
Category Analysis - Introduction
See how your categories, brands, and SKUs are performing across channels, regions, and time.
What is Category Analysis?
Category Analysis is the Revstack module you use to answer one core question: how is your business performing on Q-Comm and E-Comm?
The answer is organised around four pillars:
- Market Share - how much of the category belongs to you
- Traffic - how visible your brand is to shoppers
- Conversion - whether your price, content, and ratings turn views into sales
- Operations - whether your products are in stock and listed where they should be
Every page in the module shares the same filters at the top. Once you set your channel, dates, categories, and brands, every widget - across every tab - tells the same story from a different angle. This makes it easier to move between views without losing context.
The module is organised into four main tabs plus an AI Insights tab:
- Overview - a 360° snapshot of all four pillars
- Traffic - visibility and share of voice
- Conversion - pricing, discounts, ratings, and content
- Operations - availability, listing, stock, and fulfilment
- AI Insights - the top takeaways for your current scope, generated automatically\
You can also open a Drilldown on any subcategory. The Drilldown is a sidebar that lets you go deeper by brand, SKU, region, channel, or price tier.
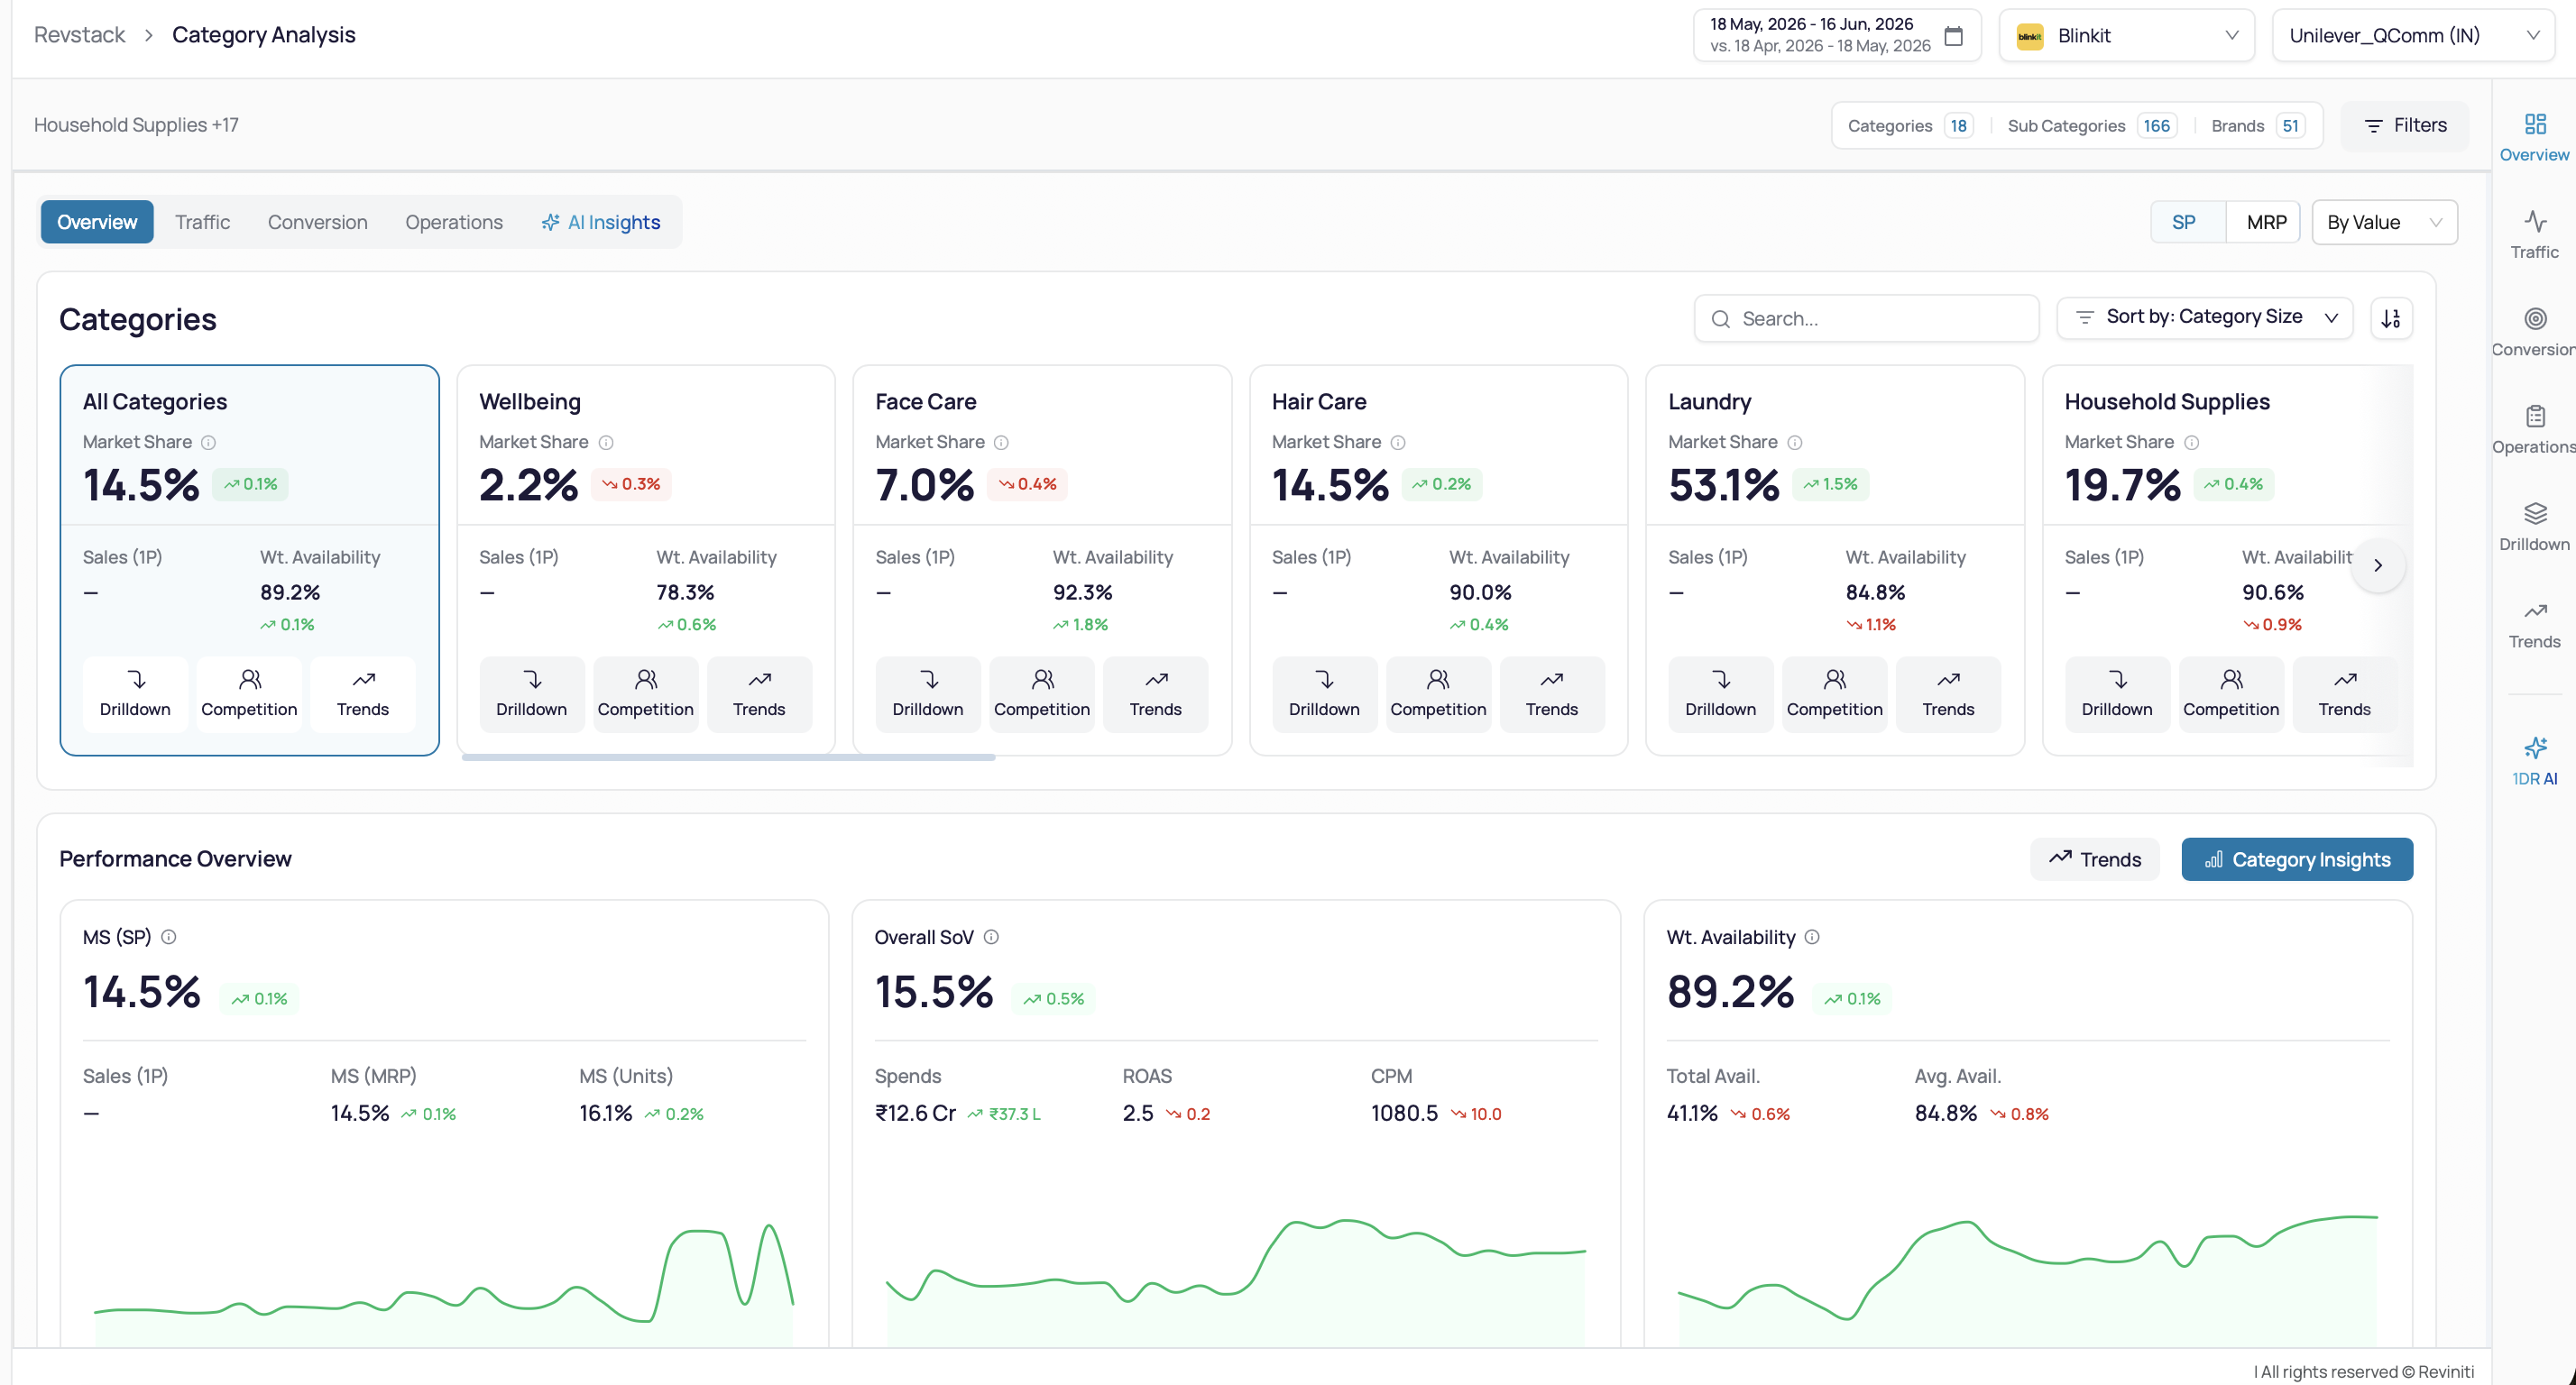
Global Filters & Toggles
The filters at the top of the page apply to every widget on every tab. Your selections stay active for your whole session, until you change them.
Primary filter bar (top-right)
- Channel - choose between Blinkit, Zepto, Instamart, or All Channels. Everything below is scoped to the channel you pick.
- Date range - defaults to Last 7 days, compared against the prior 7 days. You can pick any custom range and any comparison window.
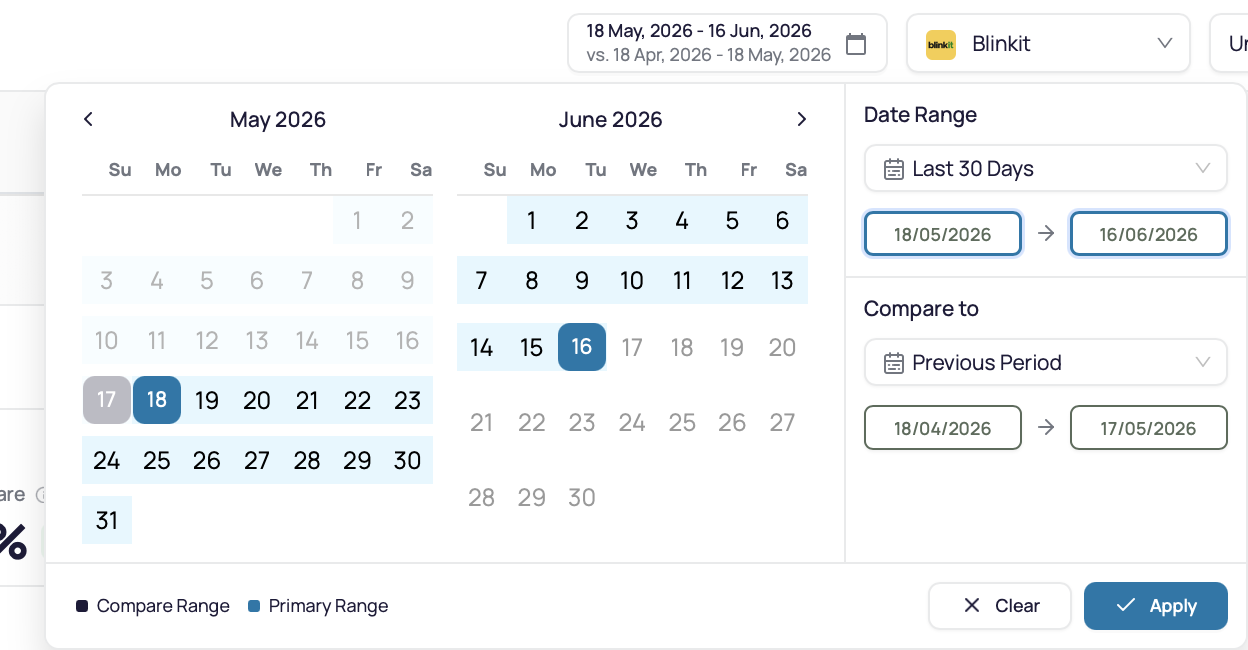
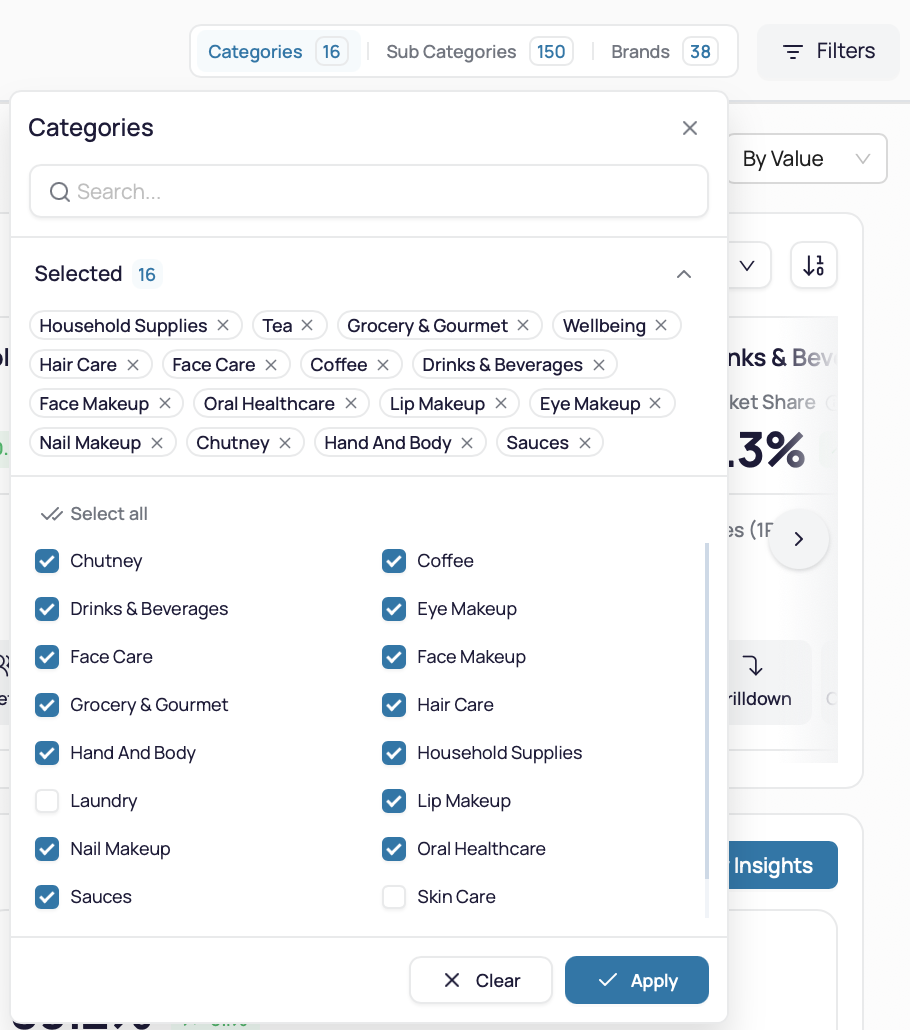
Secondary filter bar
- Categories, Sub Categories, and Brands - these come pre-selected from your UPD (User Preference Defaults), with your most important items shown first. Click any pill to refine the selection.
- Apply - confirms your selection and refreshes the page.
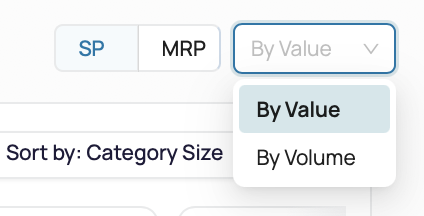
Header toggles
- MRP / SP - switches price-based metrics between Maximum Retail Price (MRP) and Selling Price (SP).
- By Value / By Volume - switches share-based metrics between revenue (₹) and units sold.
For a complete reference on what each KPI means and how it is calculated, see the Performance Metrics Definitions page.
AI Insights
The AI Insights tab gives you the top takeaways for your current scope, written for you. The insights are grouped into four areas:
- What's working well - your strengths and growth areas
- Where performance is slipping - KPIs showing negative momentum
- Key anomalies - sudden changes in share, pricing, or availability
- Opportunities - quick wins and growth levers worth exploring
AI Insights also appears as a tab inside every Drilldown sidebar. There, the takeaways are scoped to whatever you have selected - a specific subcategory, brand, SKU, region, or channel.
💡 Tip: AI Insights respects your active filters. The narrower your scope, the sharper the insights. For example, pick a single subcategory and a single region before opening the tab to get the most focused recommendations.
Product Hover Card
The Product Hover Card is a quick-look tooltip that appears when you hover on an SKU row. It gives you the key facts about the SKU at a glance, so you don't have to open a full drilldown just to check the basics.
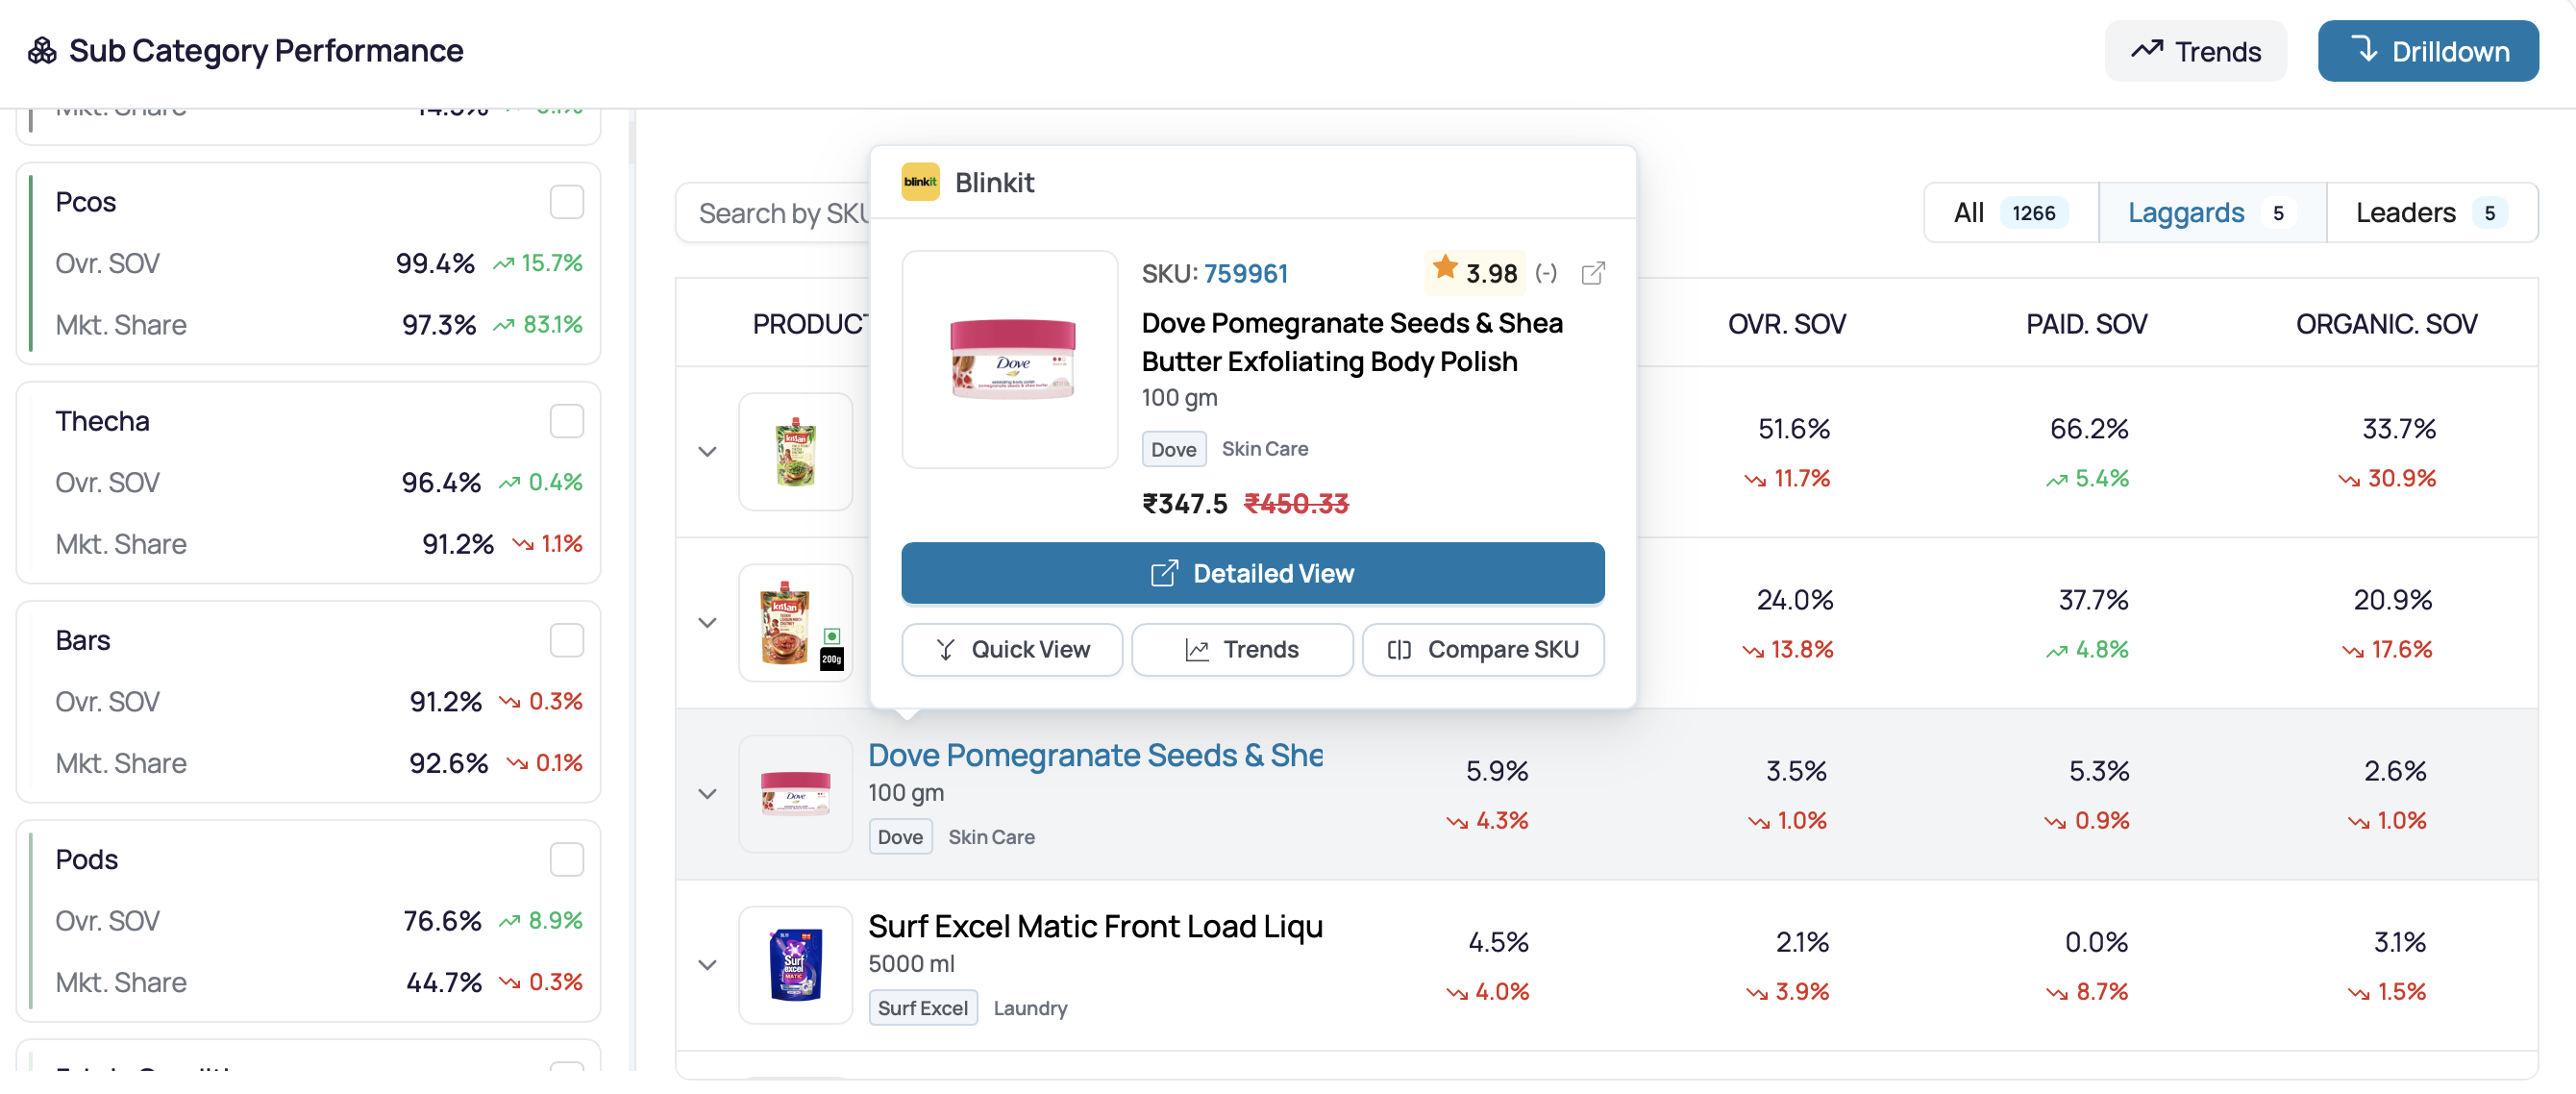
Where it appears
The Product Hover Card appears when you hover on a leader or laggard SKU row in the Sub-Category Performance widget's SKU table. It works across all four main tabs - Overview, Traffic, Conversion, and Operations.
What it shows
- Channel pill at the top (Blinkit, Zepto, or Instamart) - confirms which channel the metrics are sourced from
- Product image
- SKU ID (blue, clickable) - opens the product on the platform in a new tab
- External-link icon next to the rating - also opens the platform listing in a new tab
- Product name and pack size
- Brand pill and category tag
- Selling Price, with the MRP struck through next to it
- Customer rating with rating count
Action buttons
Four shortcut buttons sit at the bottom of the card:
- Detailed View - opens a full Product Analysis page for the SKU, where you can investigate every metric in depth. (Product Analysis is the third Revstack module - see its own documentation.)
- Quick View - opens a Product Sidebar on the current page, with four tabs: Product Overview, Competitor Analysis, Cross Region, and Cross Channel. Use this when you want a quick check without breaking your current flow.
- Trends - opens the Trends View modal, scoped to this single SKU, so you can see how its metrics have moved over time.
- Compare SKU - opens a Compare SKUs view in a new tab (within Product Analysis). You can stack up to 4 SKUs side by side and compare every metric across them as rows. This is the best view for benchmarking against close competitors, or for comparing variants within your own portfolio.
💡 Tip: Use Quick View to investigate without leaving the page you're on. Use Detailed View when you're ready for a full SKU-level deep dive. Use Compare SKU when you've spotted a problem SKU and want to see exactly what its top rivals are doing differently.
To explore each tab in detail, head to the Overview, Traffic, Conversion, Operations, Drilldown Views, or Performance Metrics Definitions pages. For the other Revstack modules, see the companion docs: Navigator and Product Analysis.