
Category Analysis - Traffic Page
Your view for visibility and reach.
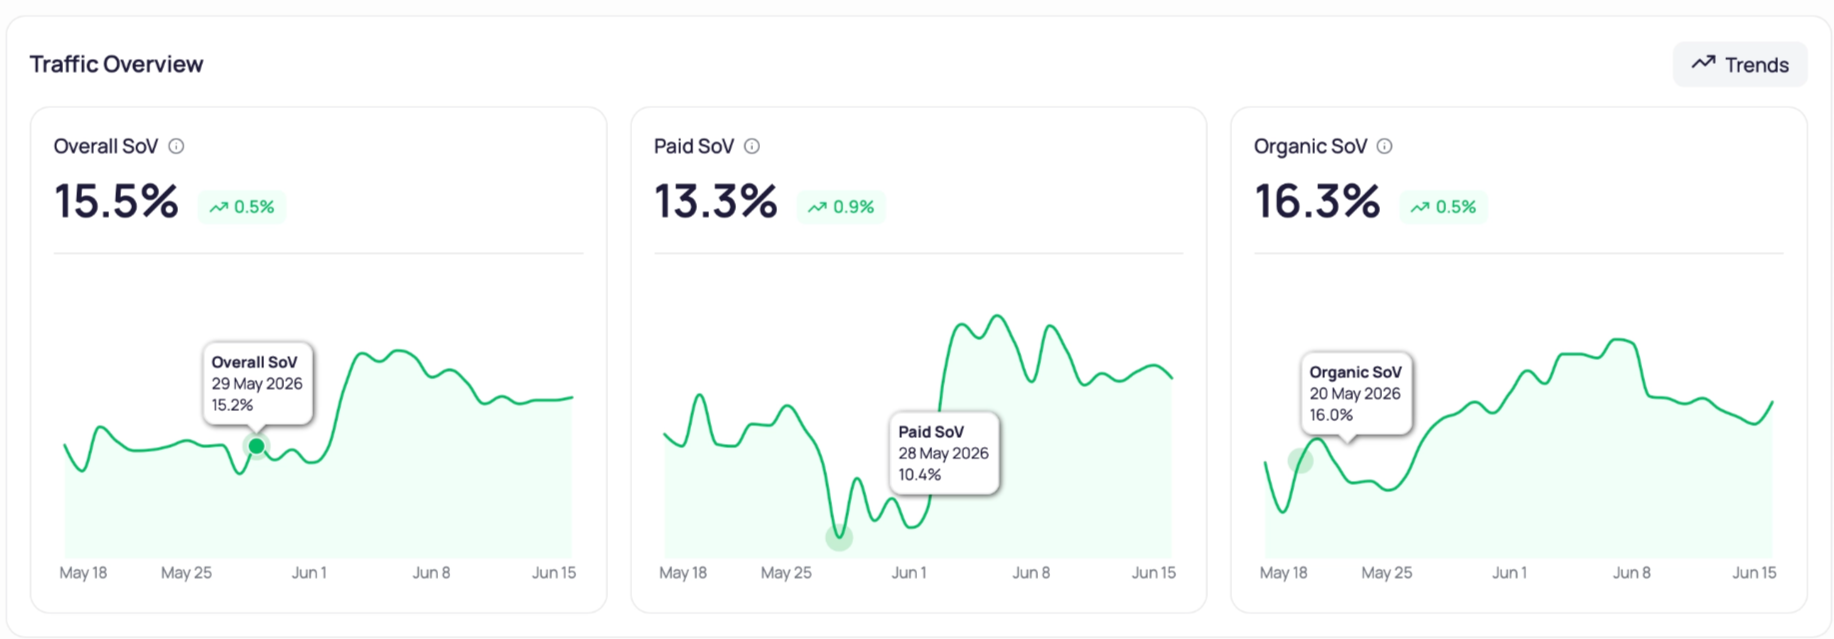
The Traffic page tracks visibility across Overall SoV, Paid SoV, and Organic SoV. It connects search trends, competitor moves, and keyword behaviour so you can see where traffic is growing, slipping, or being taken away.
Traffic Overview (Top Cards)
Three KPI cards give you a quick visibility check:
- Overall SoV % - your total visibility (paid plus organic)
- Paid SoV % - your visibility from sponsored placements
- Organic SoV % - your visibility from organic search results
Each card shows the current value, the trend versus the comparison period.
For KPI details, see Performance Metrics Definitions.
SoV & Search Volume
This section tracks how visibility shifts over time and across subcategories:
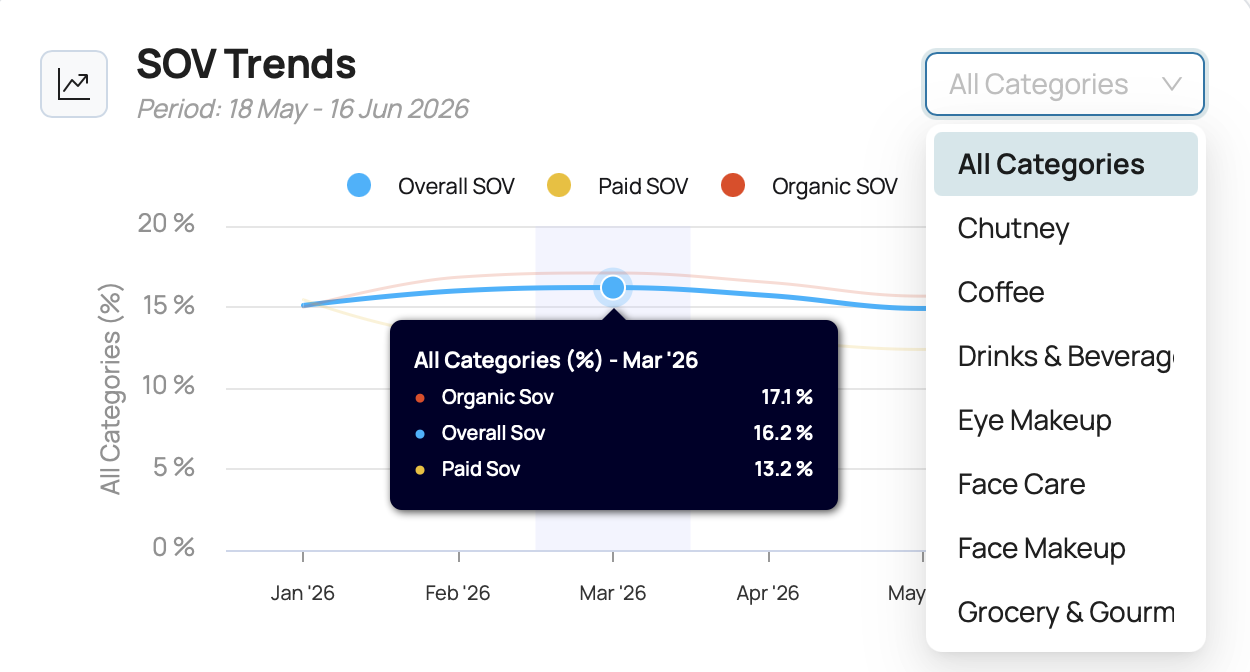
- SoV Trends (line chart) - shows how Overall, Paid, and Organic SoV move over time. Use it to tell if a visibility shift is short-term or here to stay.
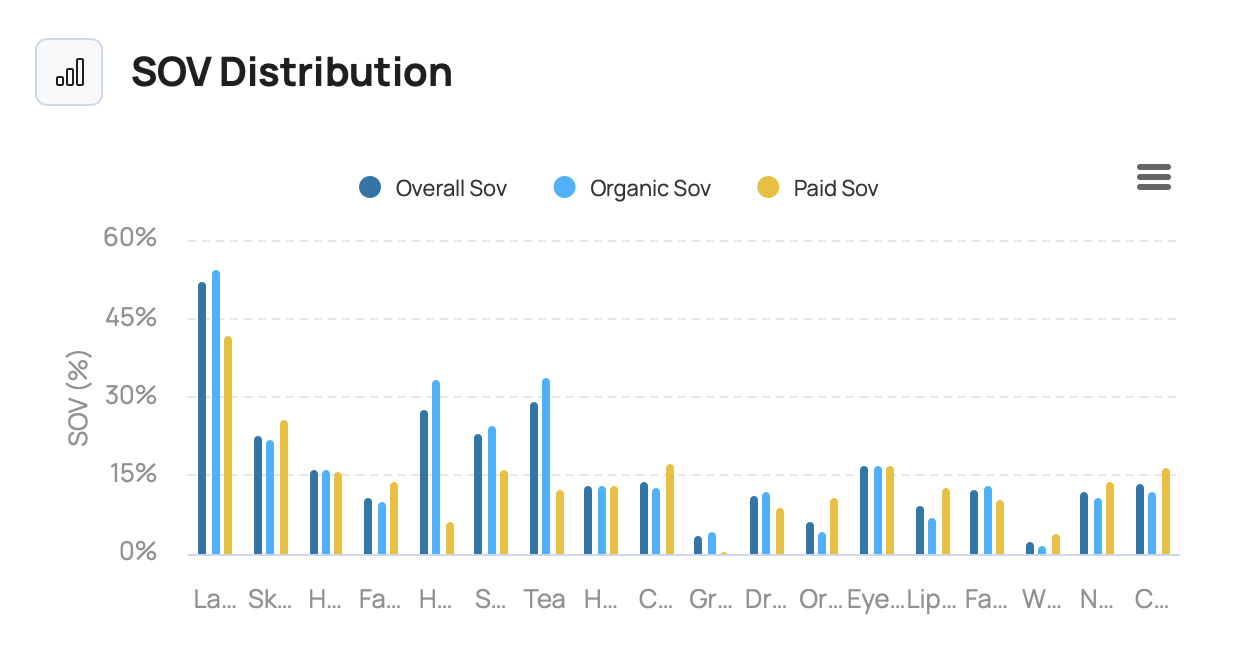
- SoV Distribution (bar chart) - compares Overall, Paid, and Organic SoV across your selected subcategories. Shows where your visibility is concentrated.
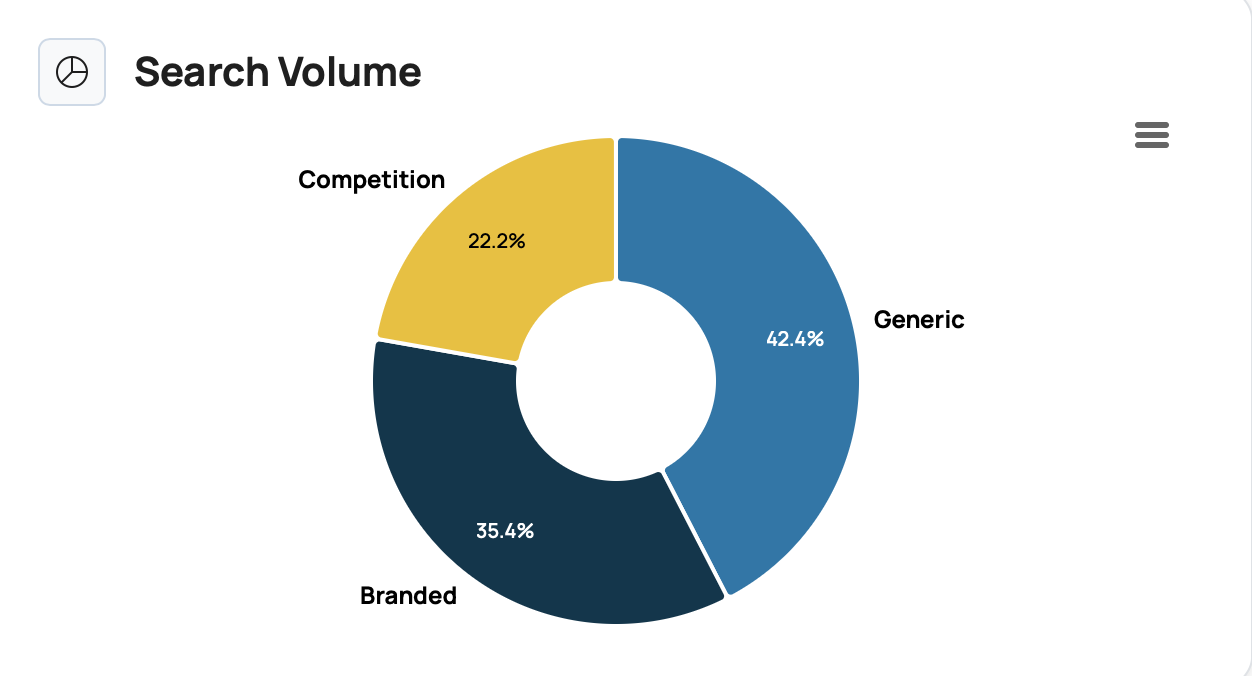
- Search Volume (donut) - splits traffic sources into three types:
- Generic - category-driven demand
- Branded - direct brand interest
- Competition - searches that mention competitor names
- Competition Trends (line chart) - tracks how each competitor’s SoV is moving over time.
|
|
|
|
|
|
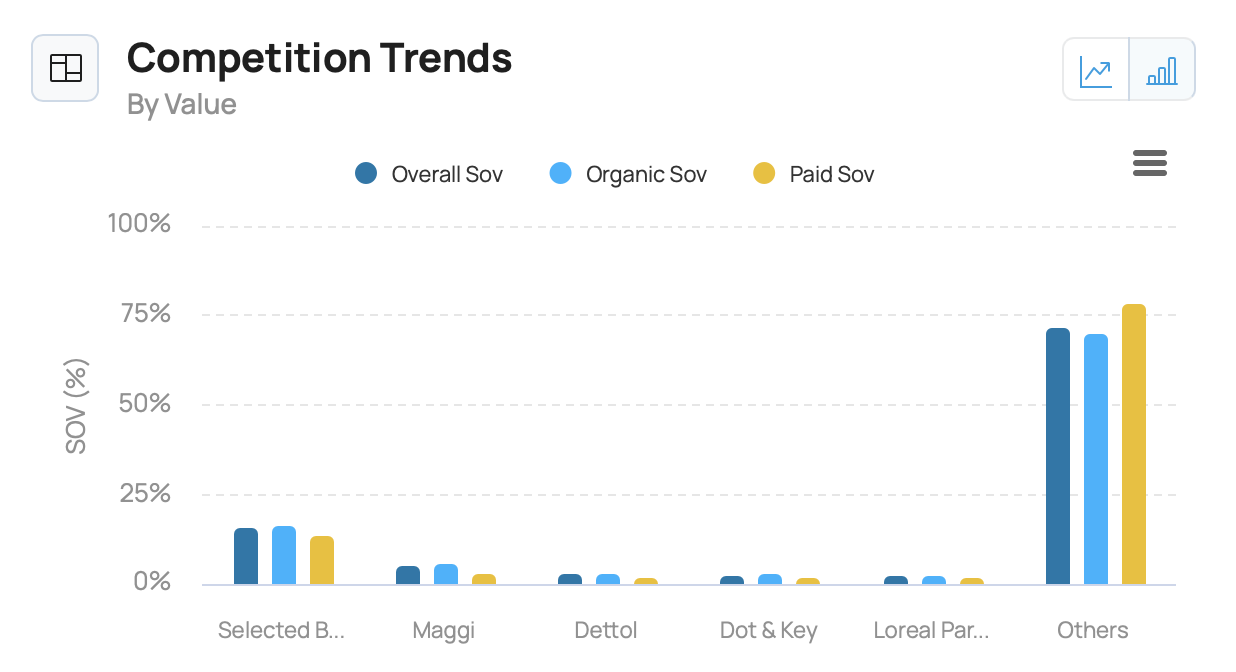
💡Tip: The toggle in each chart’s top-right lets you switch between line and bar or pie views.
Sub-Category Traffic Performance
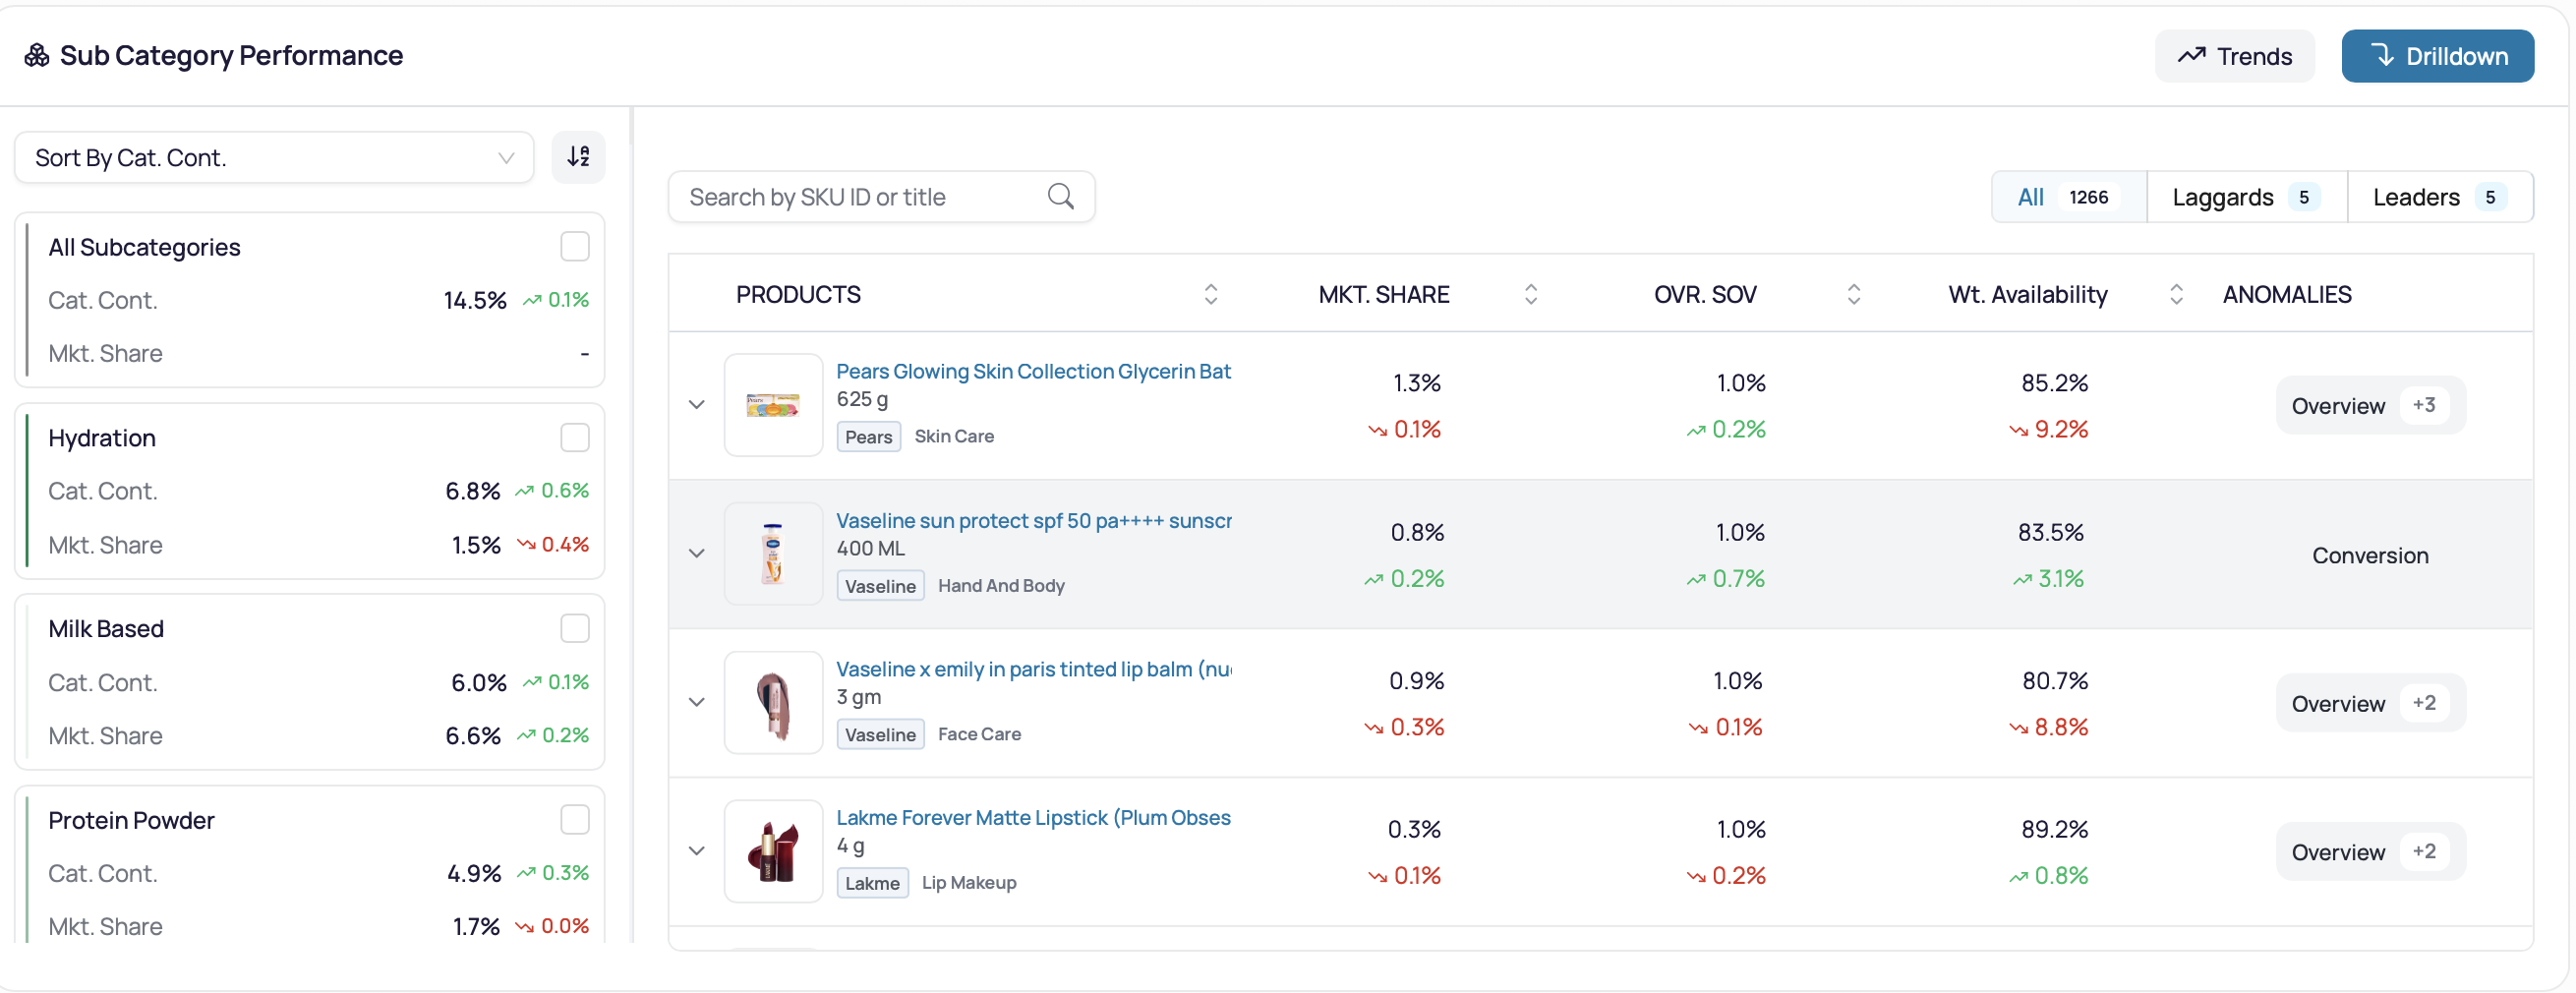
The Traffic version of the Sub-Category Performance widget:
- Default sort → Overall SoV (high to low)
- Columns → Market Share, Overall SoV, Paid SoV, Organic SoV
- Leaders / Laggards tabs to flip the ranking
- Drilldown opens the full sidebar for brand, SKU, region, channel, and feature views
Keyword Performance
This table links what shoppers search for to how visible you are on those searches. For each keyword, you can see:
- Keyword type - Branded, Generic, or Competition
- Indexed search volume - what share of all queries this keyword represents
- Overall, Paid, and Organic SoV for the keyword
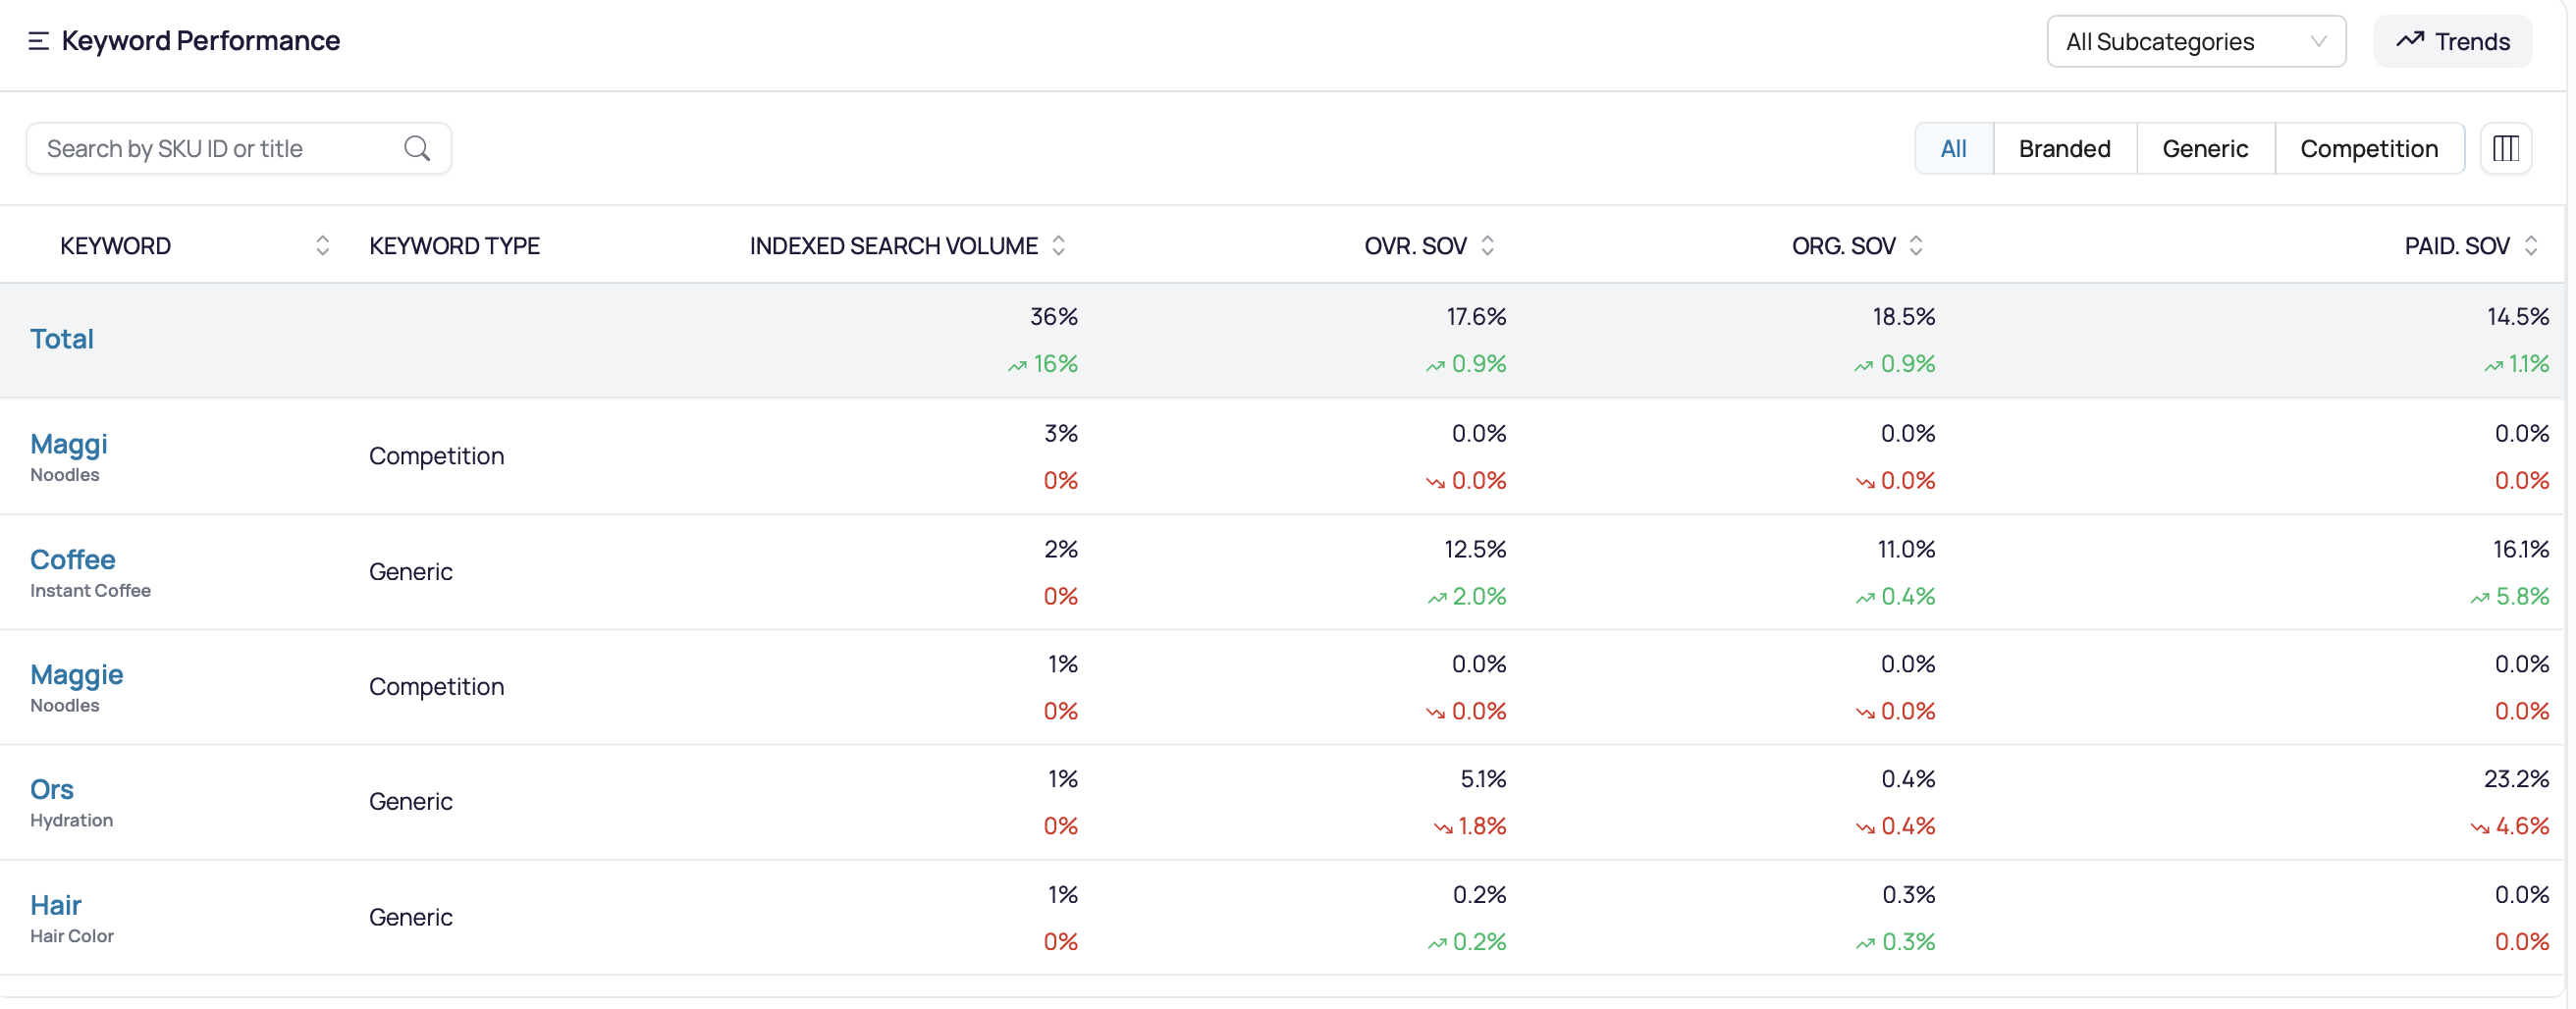
Use the All Keywords dropdown in the top-right to filter by keyword type. For example, pick Branded to check if shoppers searching for your brand are actually seeing you. Pick Competition to see where rival brands are stealing impressions on your terms.
Regional Level Traffic Performance
Traffic broken down by region:
- Left panel - region-wise SoV and Market Share (PAN India, Mumbai, Delhi NCR, Bengaluru, Hyderabad, Kolkata, Rest of India).
- Right table - subcategory metrics by region. Includes Category Share, Market Share, Overall SoV, Paid SoV, Organic SoV, Weighted Availability, and anomalies.
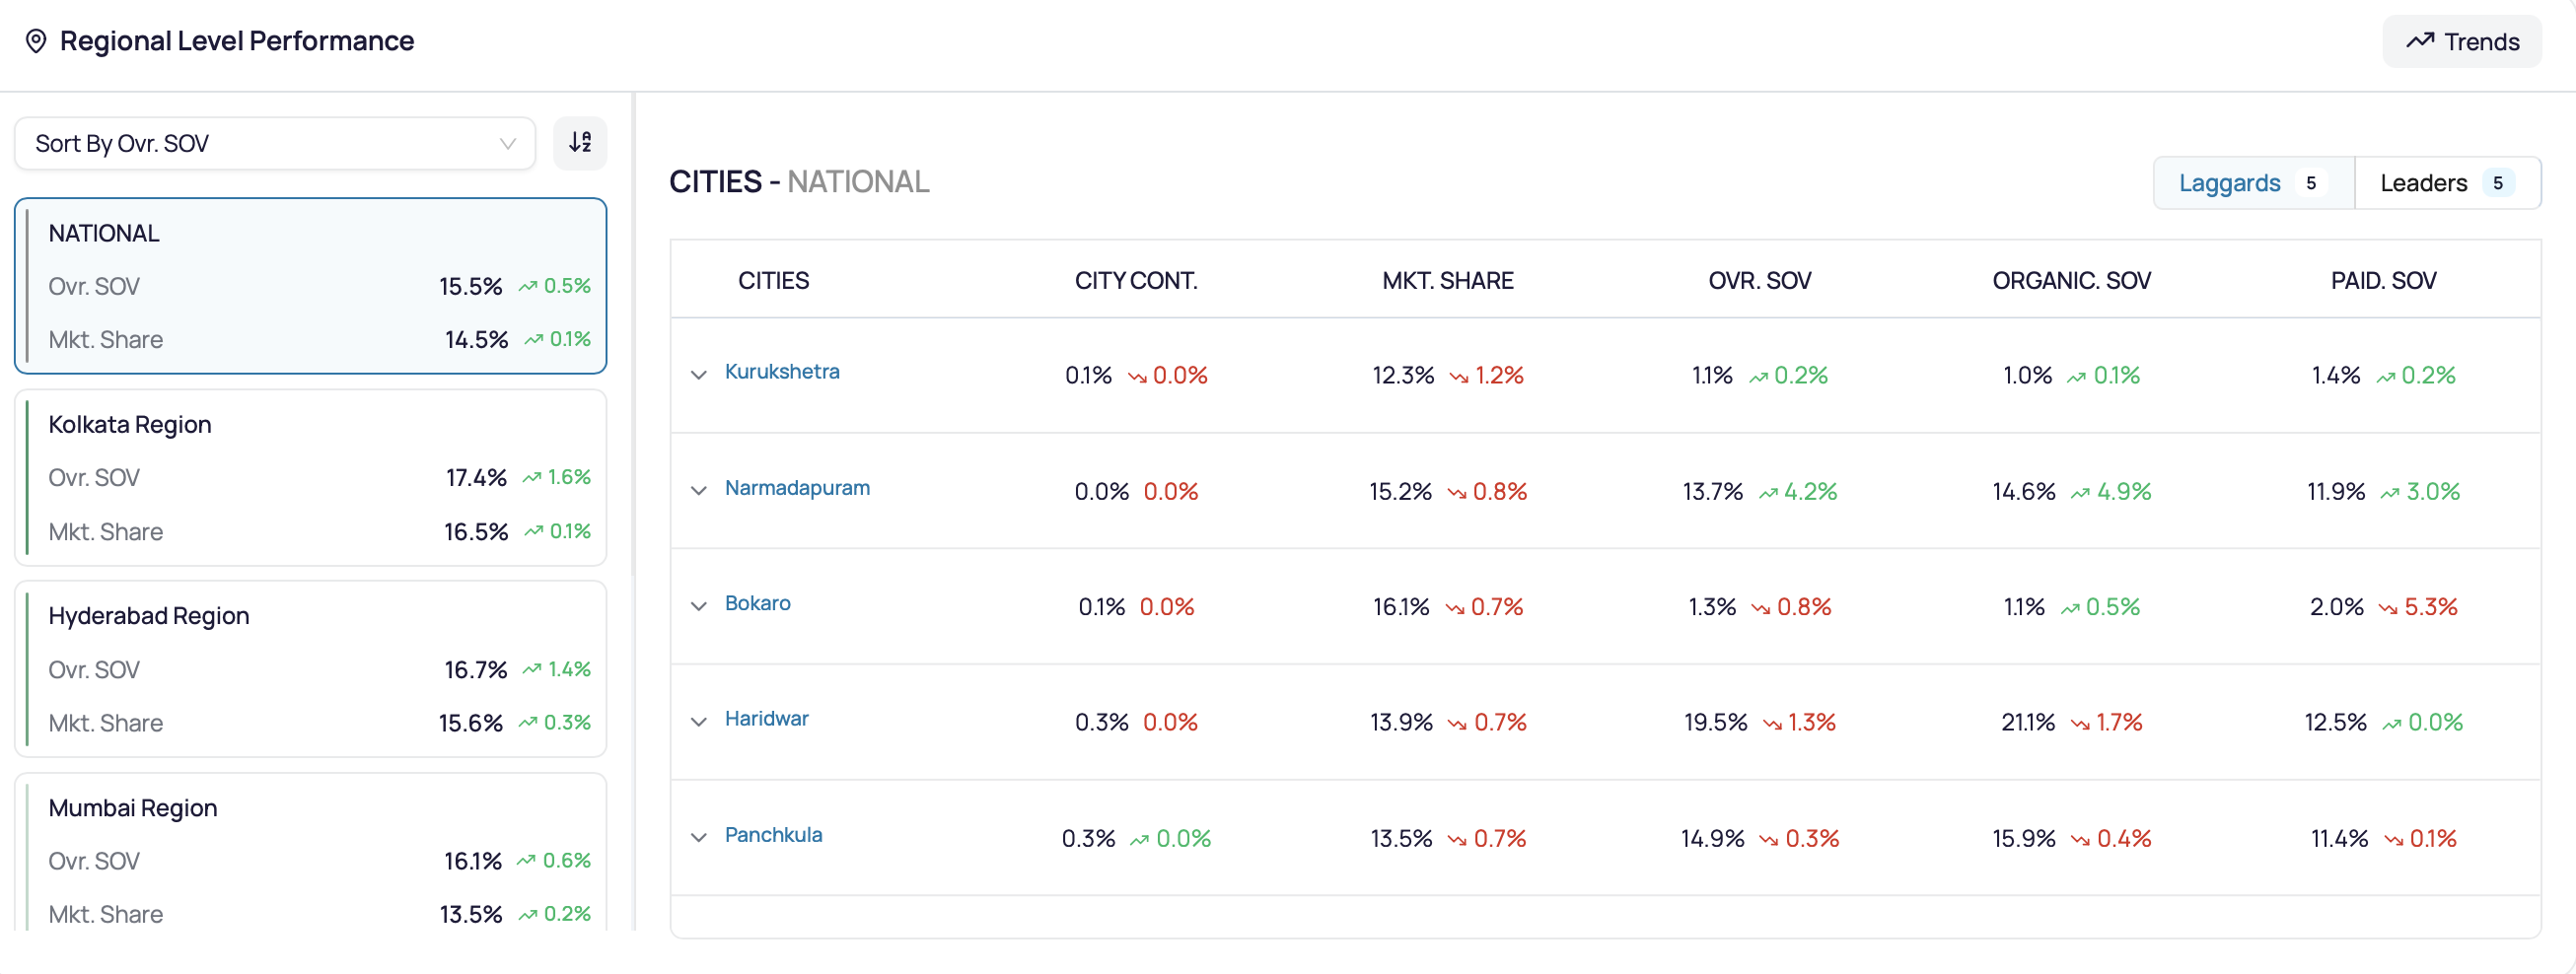
Click Drilldown to go down to sub-regions and cities (e.g., Gurugram inside Delhi NCR).