
Category Analysis - Drilldown Views
The Drilldown sidebar opens when you click the Drilldown button on a Sub-Category or Regional Performance widget, or when you click into a subcategory card. It lets you go deeper into any Category, Subcategory, SKU, Region, or Channel. All data inside the Drilldown follows your current filter selections.

The sidebar has its own tab strip:
- Overview - a snapshot of all key metrics
- Brand Analysis - side-by-side brand comparison
- SKU Analysis - product-level performance
- Cross Region - performance by region and city
- Cross Channels - performance by channel
- Feature Analysis - performance by price tier
- AI Insights - auto-generated insights for the scope
- Trends View (top-right link) - opens a timeline modal for any tab
Overview (sidebar)
Shows all key KPIs for the selected subcategory, grouped under Traffic, Conversion, and Operations with status pills on each.
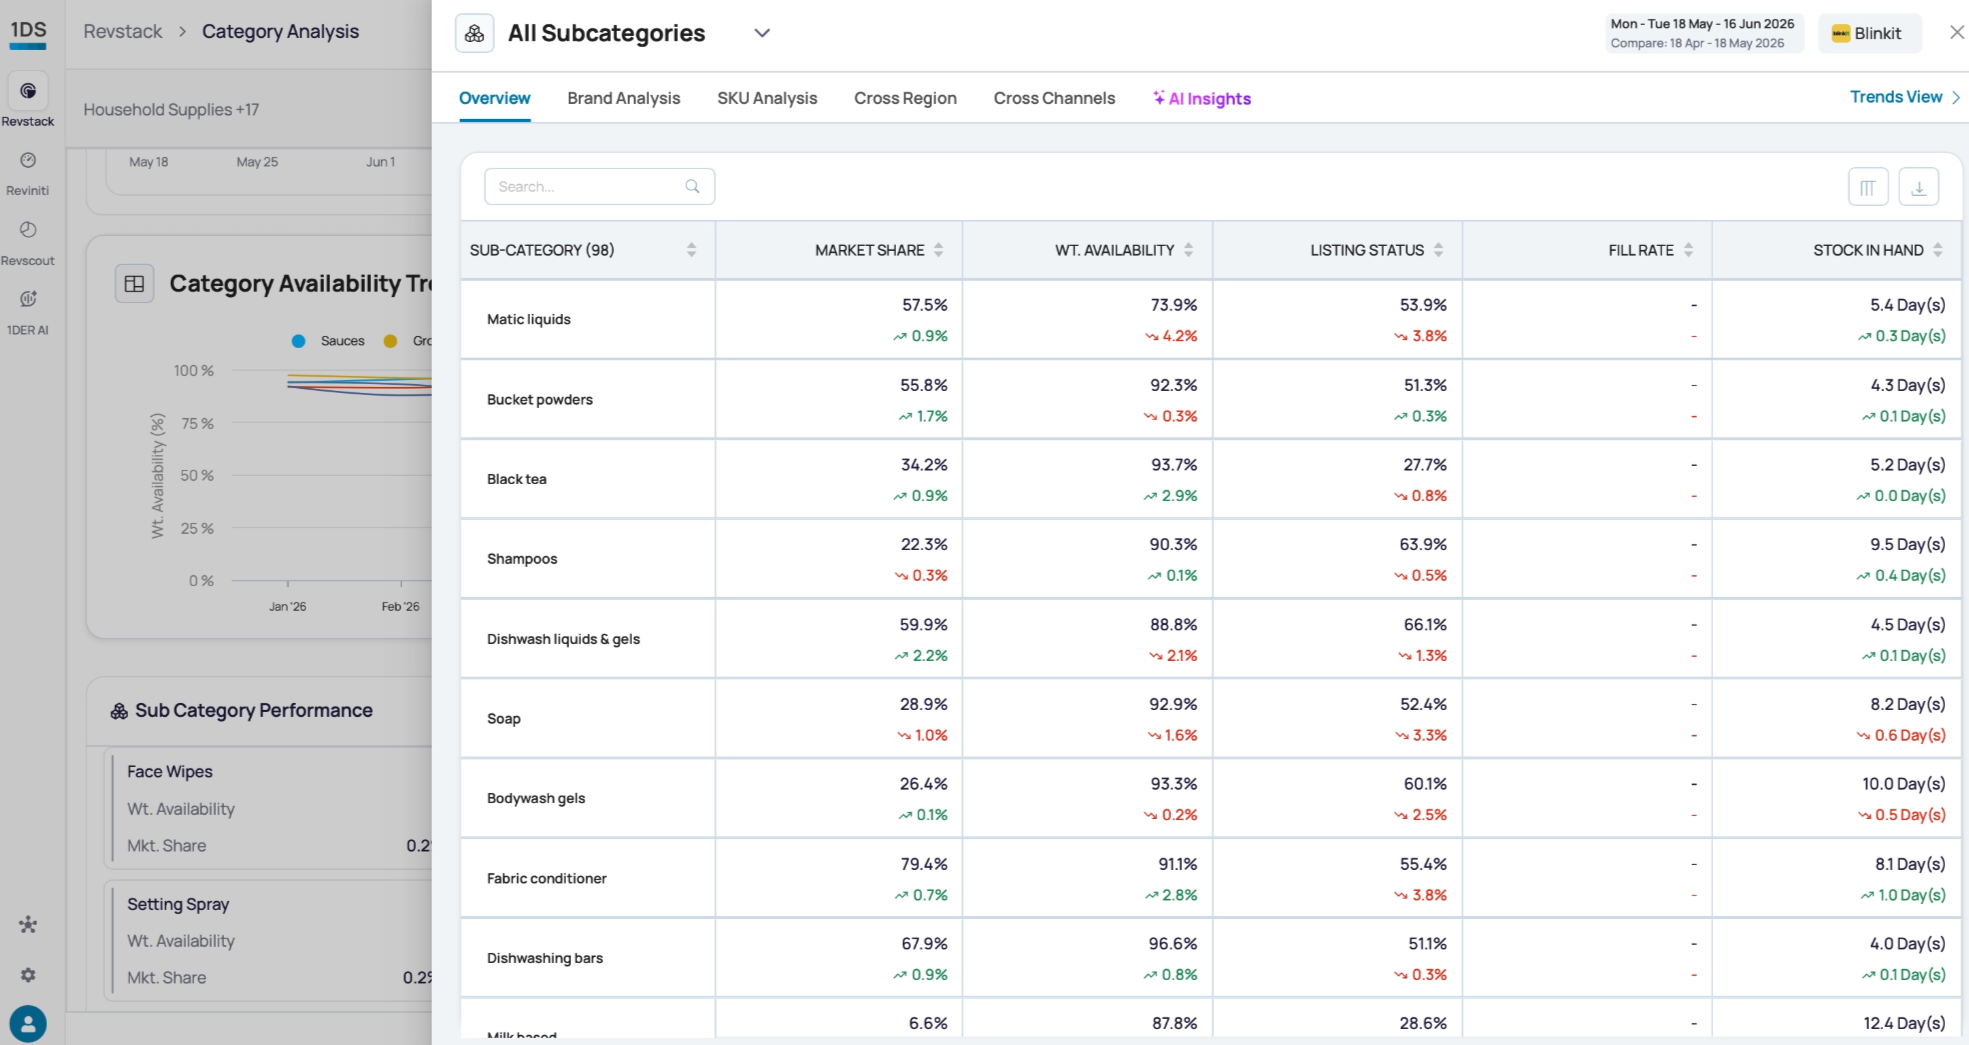
All Subcategories view: one table with every subcategory in scope as a row, and all KPIs as columns. Best for a quick check before going deeper.
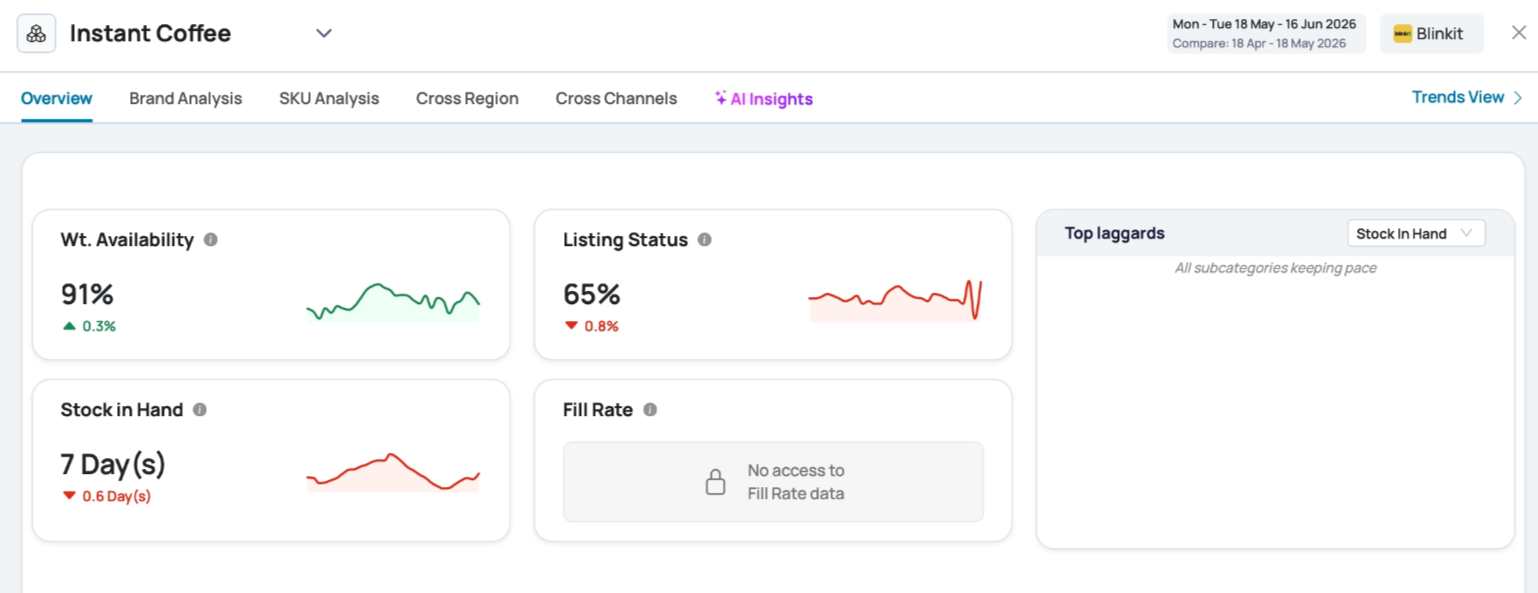
Single Subcategory view: pick a specific subcategory from the dropdown at the top to deep-dive. You’ll see the same three-lens layout as the main Overview page (Market Share, SoV, Wt. Availability + Traffic, Conversion, Operations lens cards), but scoped to just that subcategory.
Brand Analysis
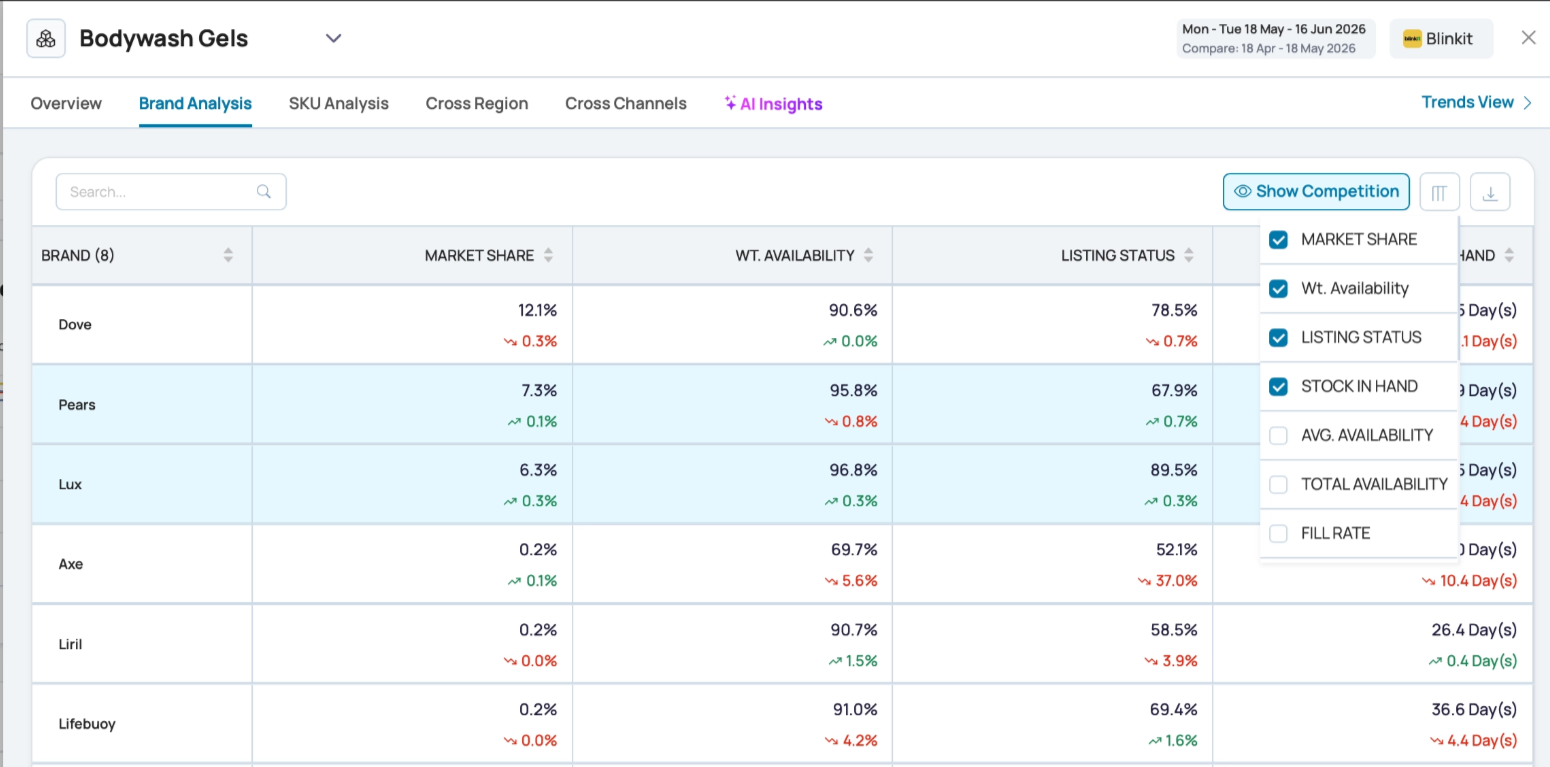
A side-by-side comparison of every brand in the selected subcategory.
- Compare your brand against top competitors on Market Share, SoV, Availability, RPI, Ratings, and more.
- Click any column header to sort by that metric - Contribution, Market Share, or anything else.
- Use the Show Competition toggle to include or hide competitor brands.
- The Search bar helps you find a specific brand.
- The Download button exports the table to Excel.
SKU Analysis
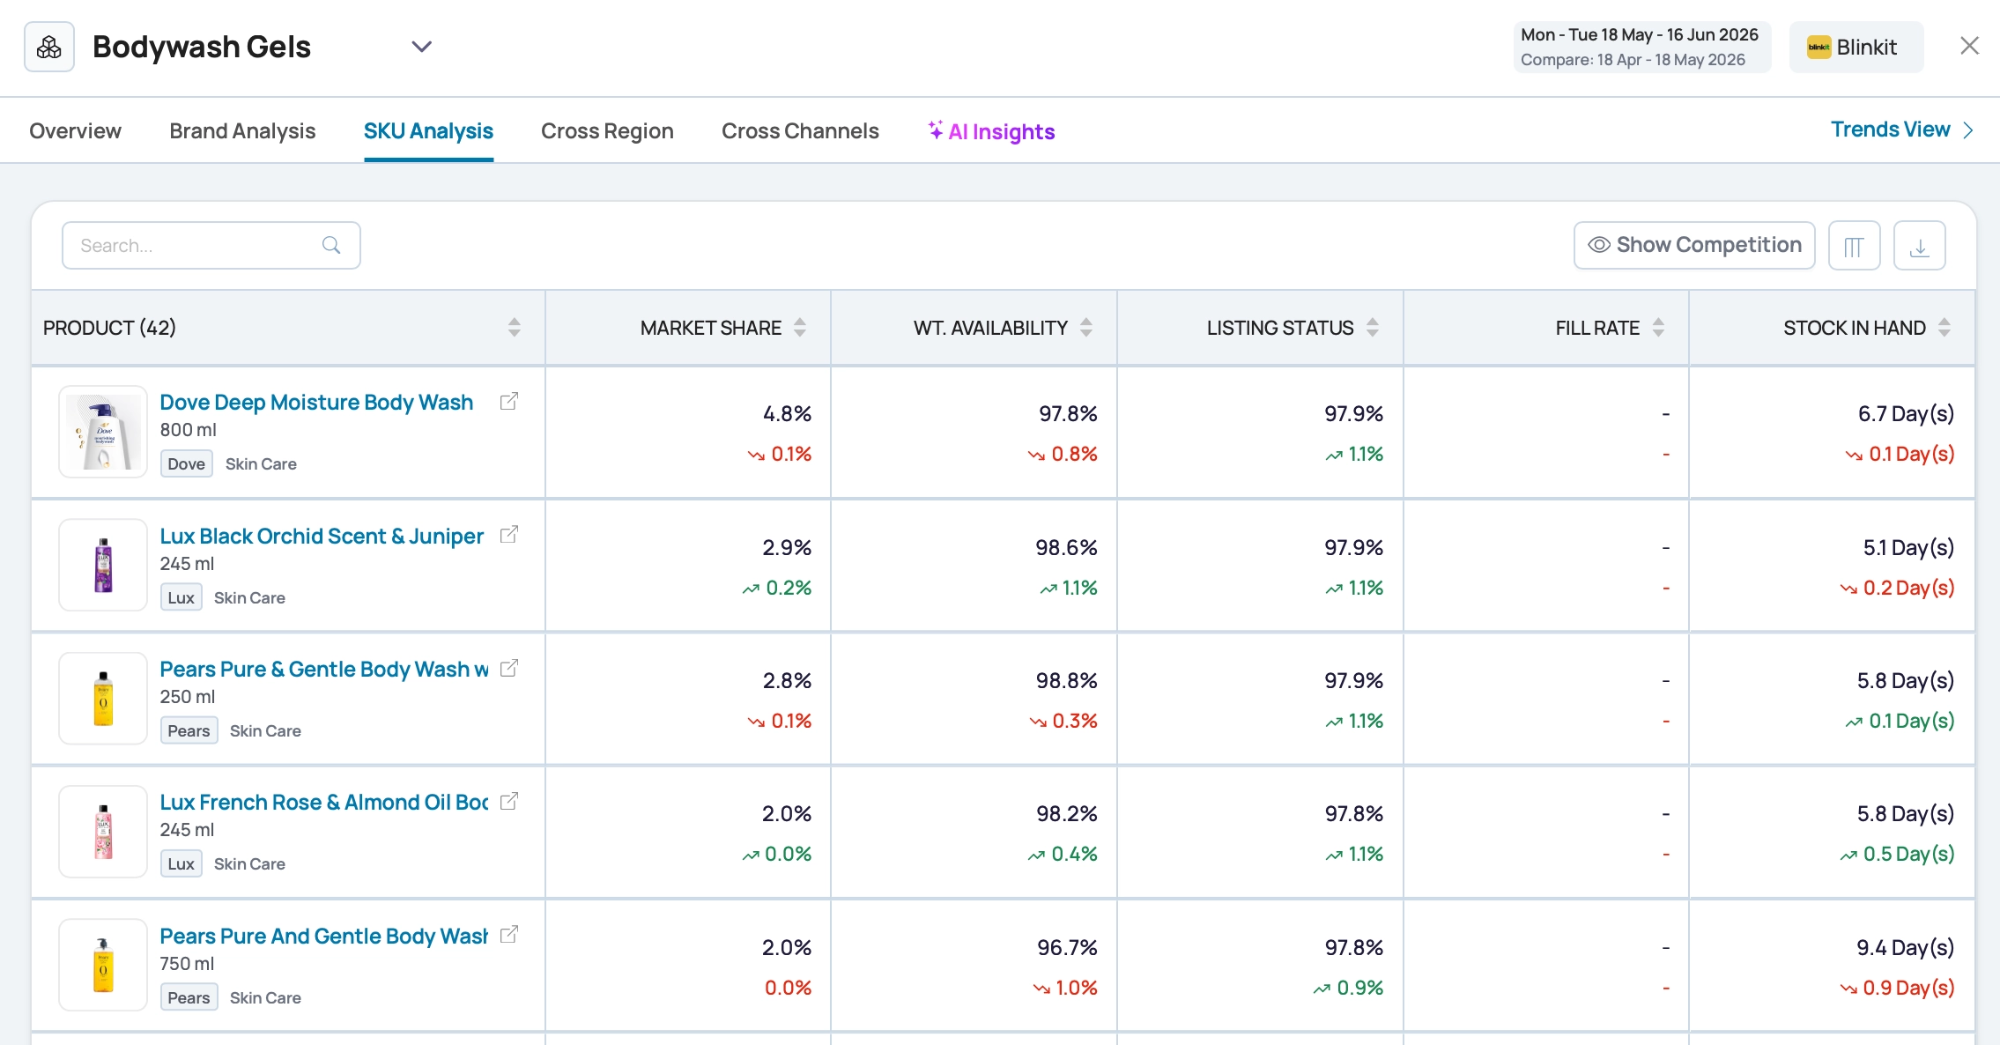
Goes down to the product level. Every SKU in the selected subcategory - yours and your competitors’ - in one table.
- Compare SKUs on share, availability, pricing, ratings, and SoV.
- Spot top SKUs to scale up. Spot laggards that need fixing.
- Catch supply gaps like stock-outs, weak content, or wrong prices.
- Search, column chooser, and Excel export are all available.
Cross Region
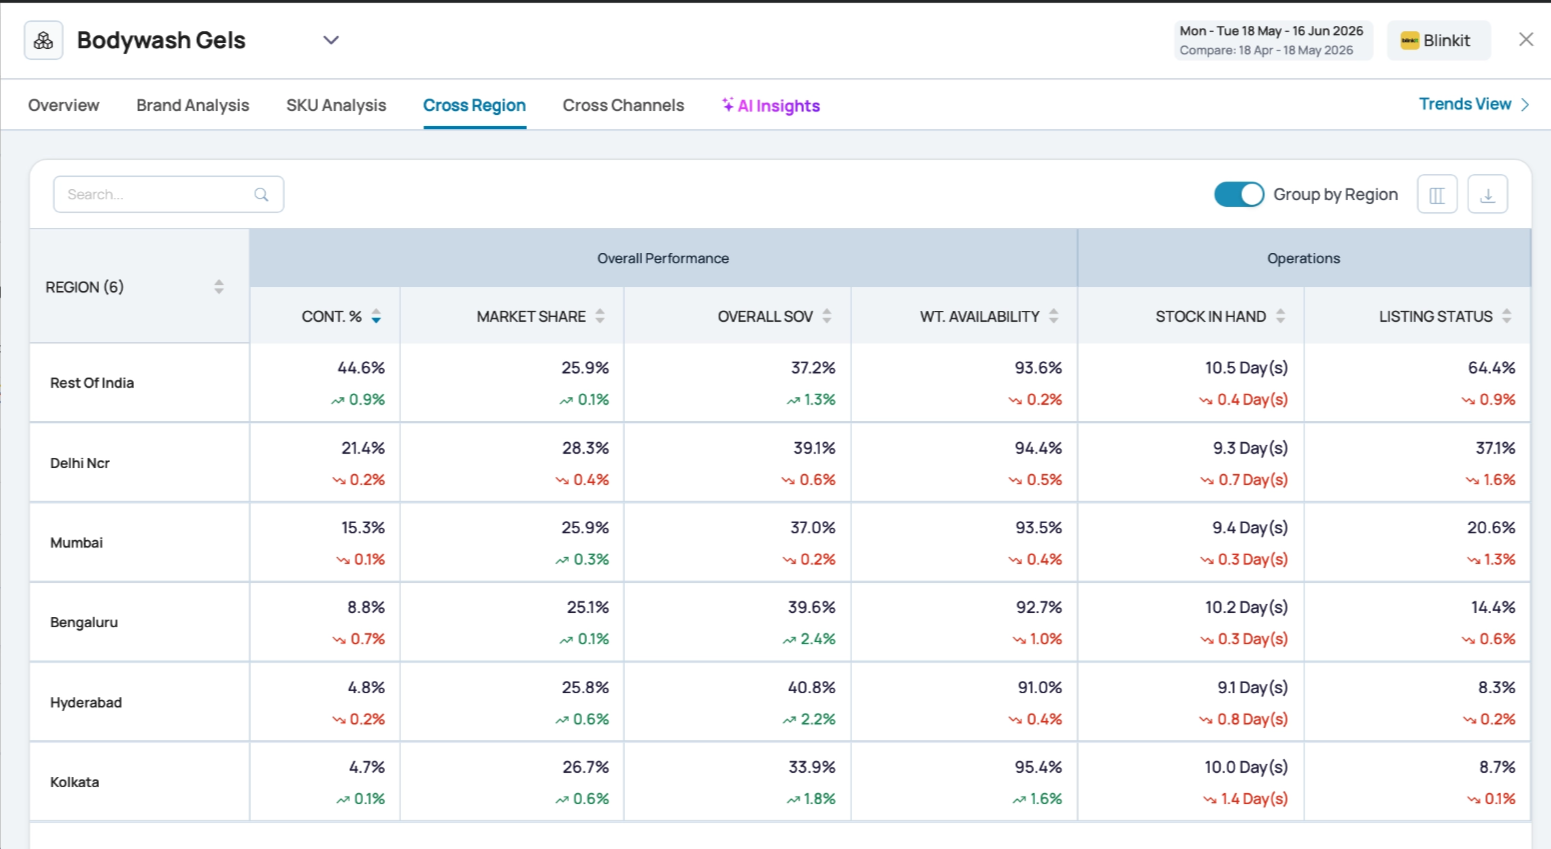
Breaks performance down by region and city (covers around 296 cities).
- Use the Region / City toggle at the top to switch between region-level and city-level views.
- See which regions and cities are pulling Market Share up or down.
- Spot high-growth markets and weak ones.
- Columns include Contribution %, Market Share, Overall SoV, Weighted Availability, Organic SoV, Paid SoV, and RPI.
Cross Channels
Compares your performance across Ecomm and Qcomm platforms (Amazon, Instamart, Blinkit, Zepto).
- Compare KPIs like Sales (1P), Market Share, SoV, Availability, and RPI by channel.
- Spot channel-specific gaps - for example, strong on ecomm but weak on Q-Comm, which means you’re missing a quick-commerce opportunity.
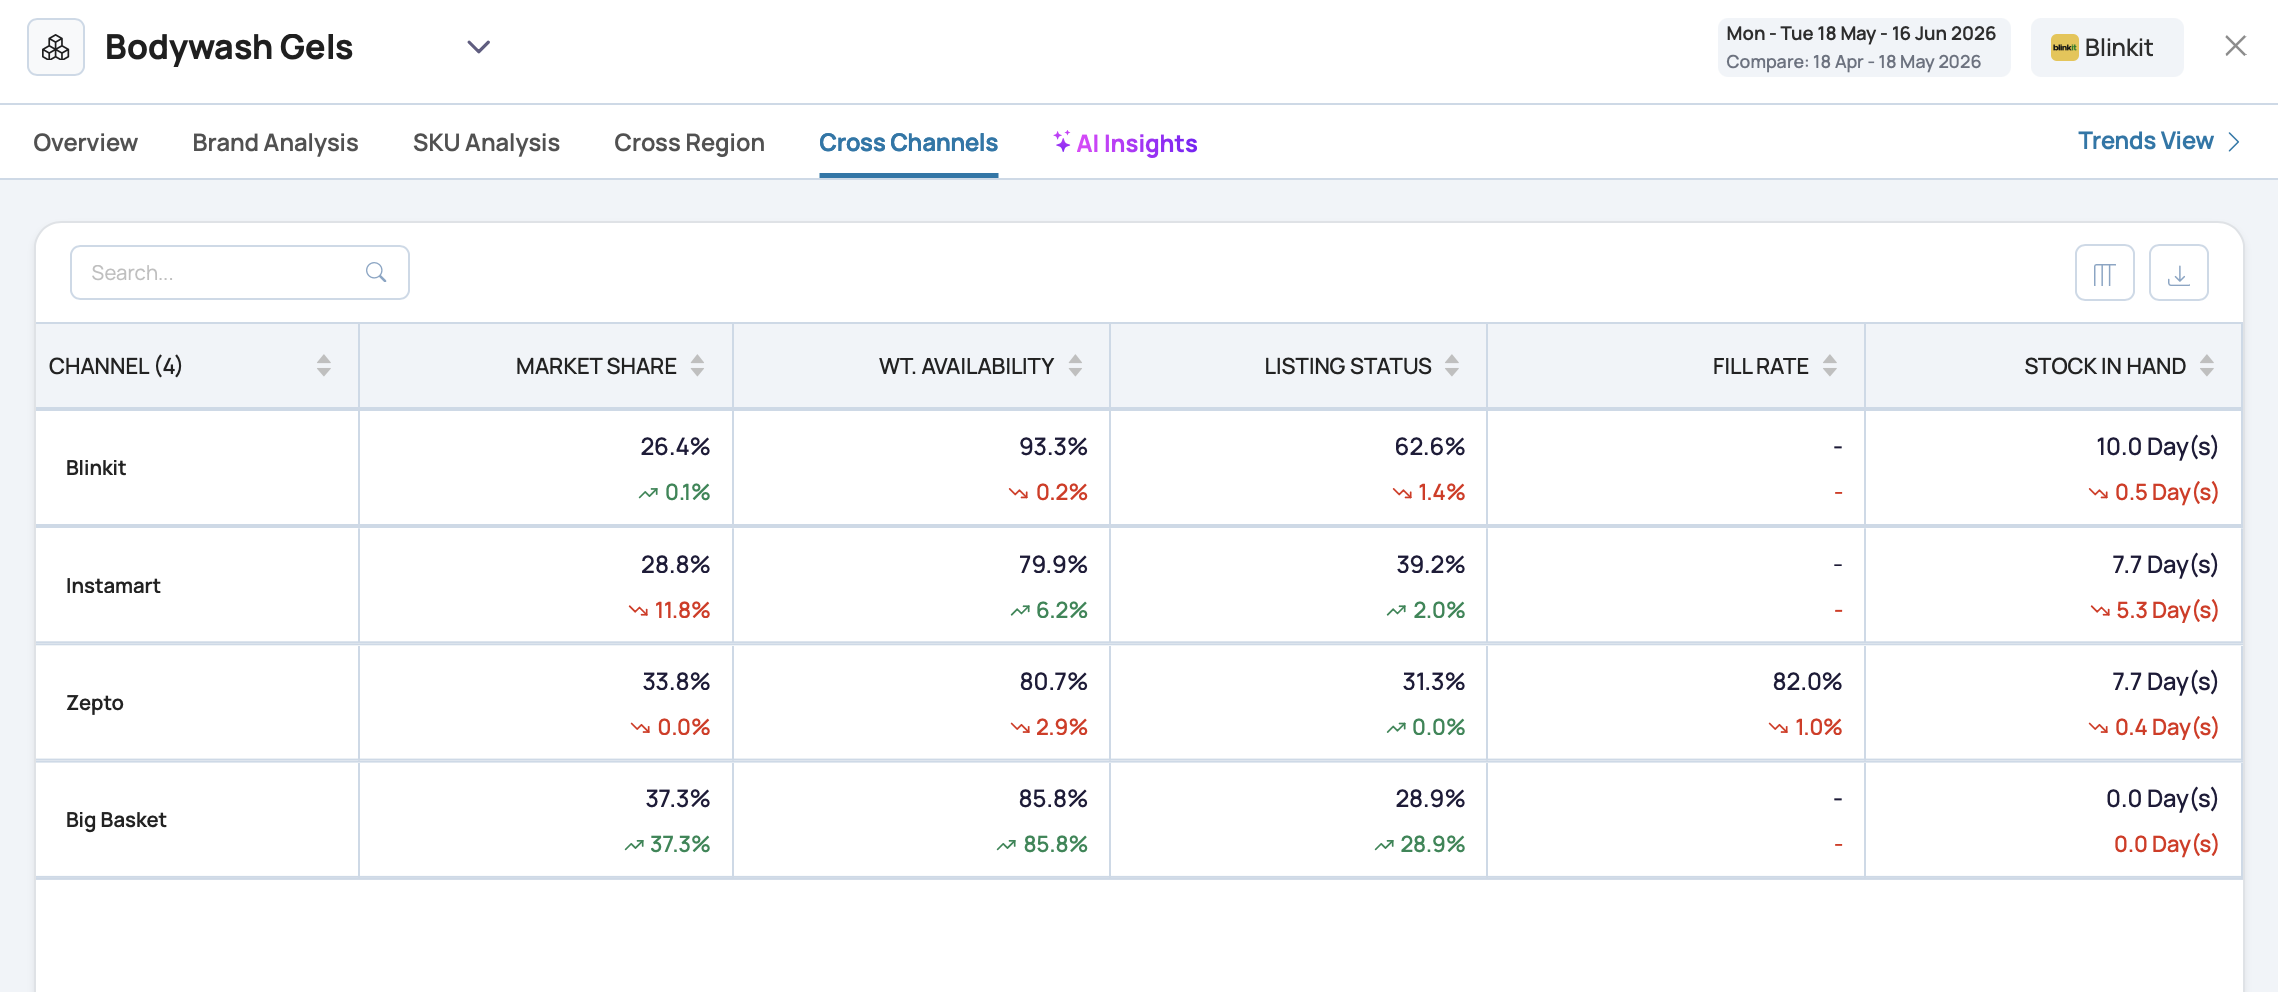
💡 Tip: Use Cross Channels right after you spot a Market Share dip on the main page. It tells you if the dip is across every channel or limited to one.
Feature Analysis
Shows how you’re performing across price tiers within the subcategory. The tiers are usually:
- Super Premium
- Premium
- Mass
- Economy
- Not Tagged (SKUs that haven’t been classified yet)
Columns include Feature Contribution, Market Share, Overall SoV, Weighted Availability, Organic SoV, Paid SoV, and RPI.
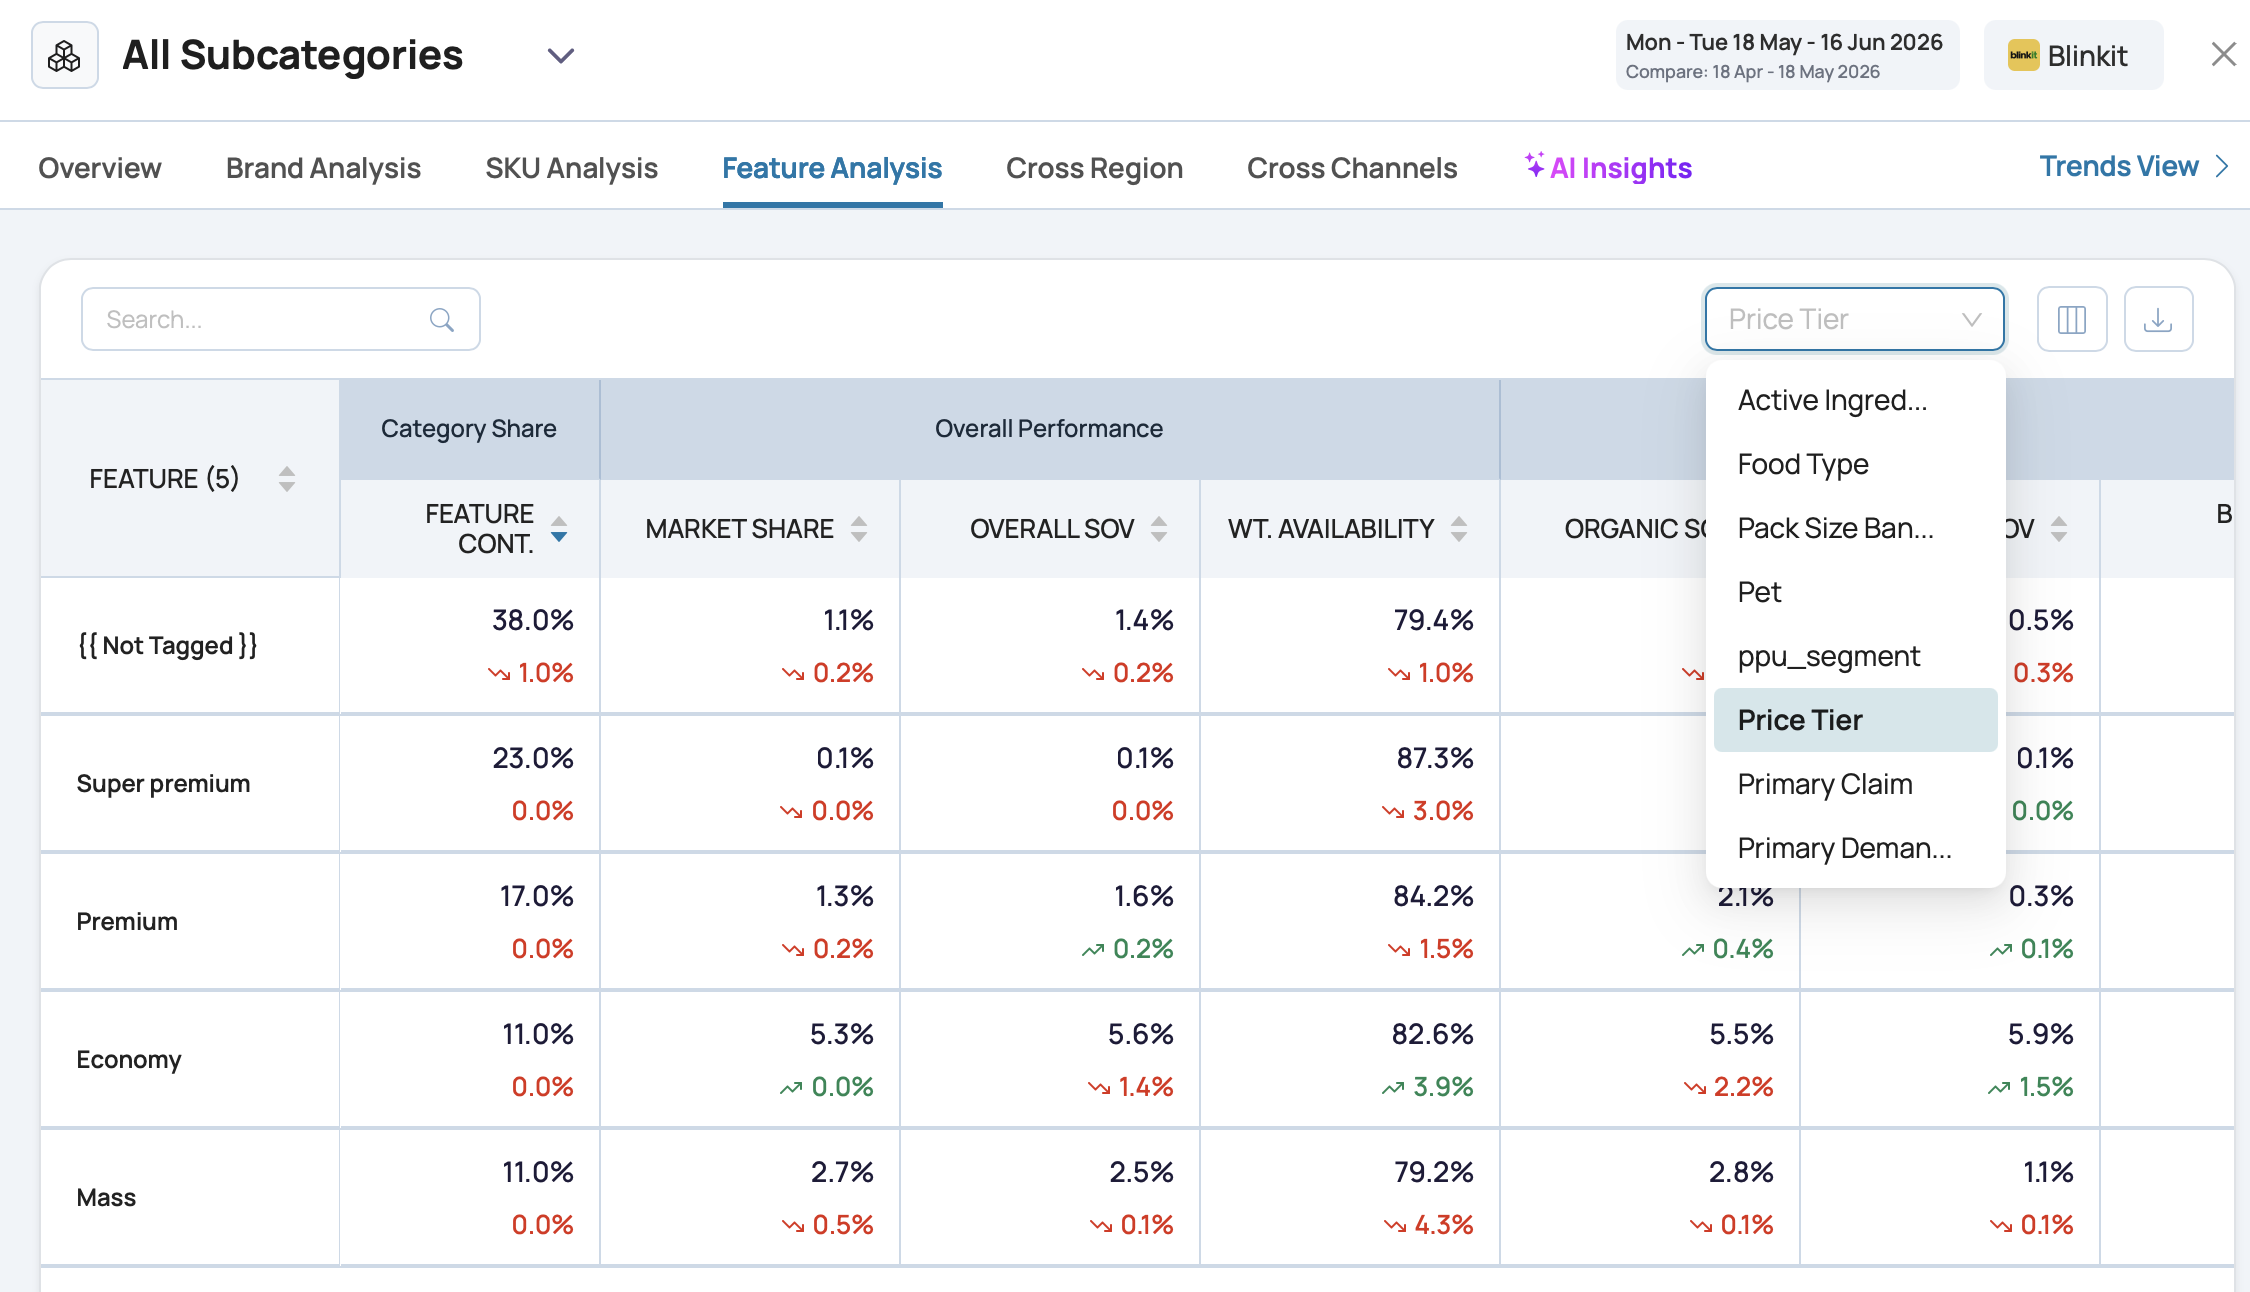
Use this view to answer questions like “Am I losing share in the Premium tier?” or “Is the Mass tier driving my volume at the cost of margin?” A switch at the top lets you change the feature dimension if your account has other types set up.
Trends View
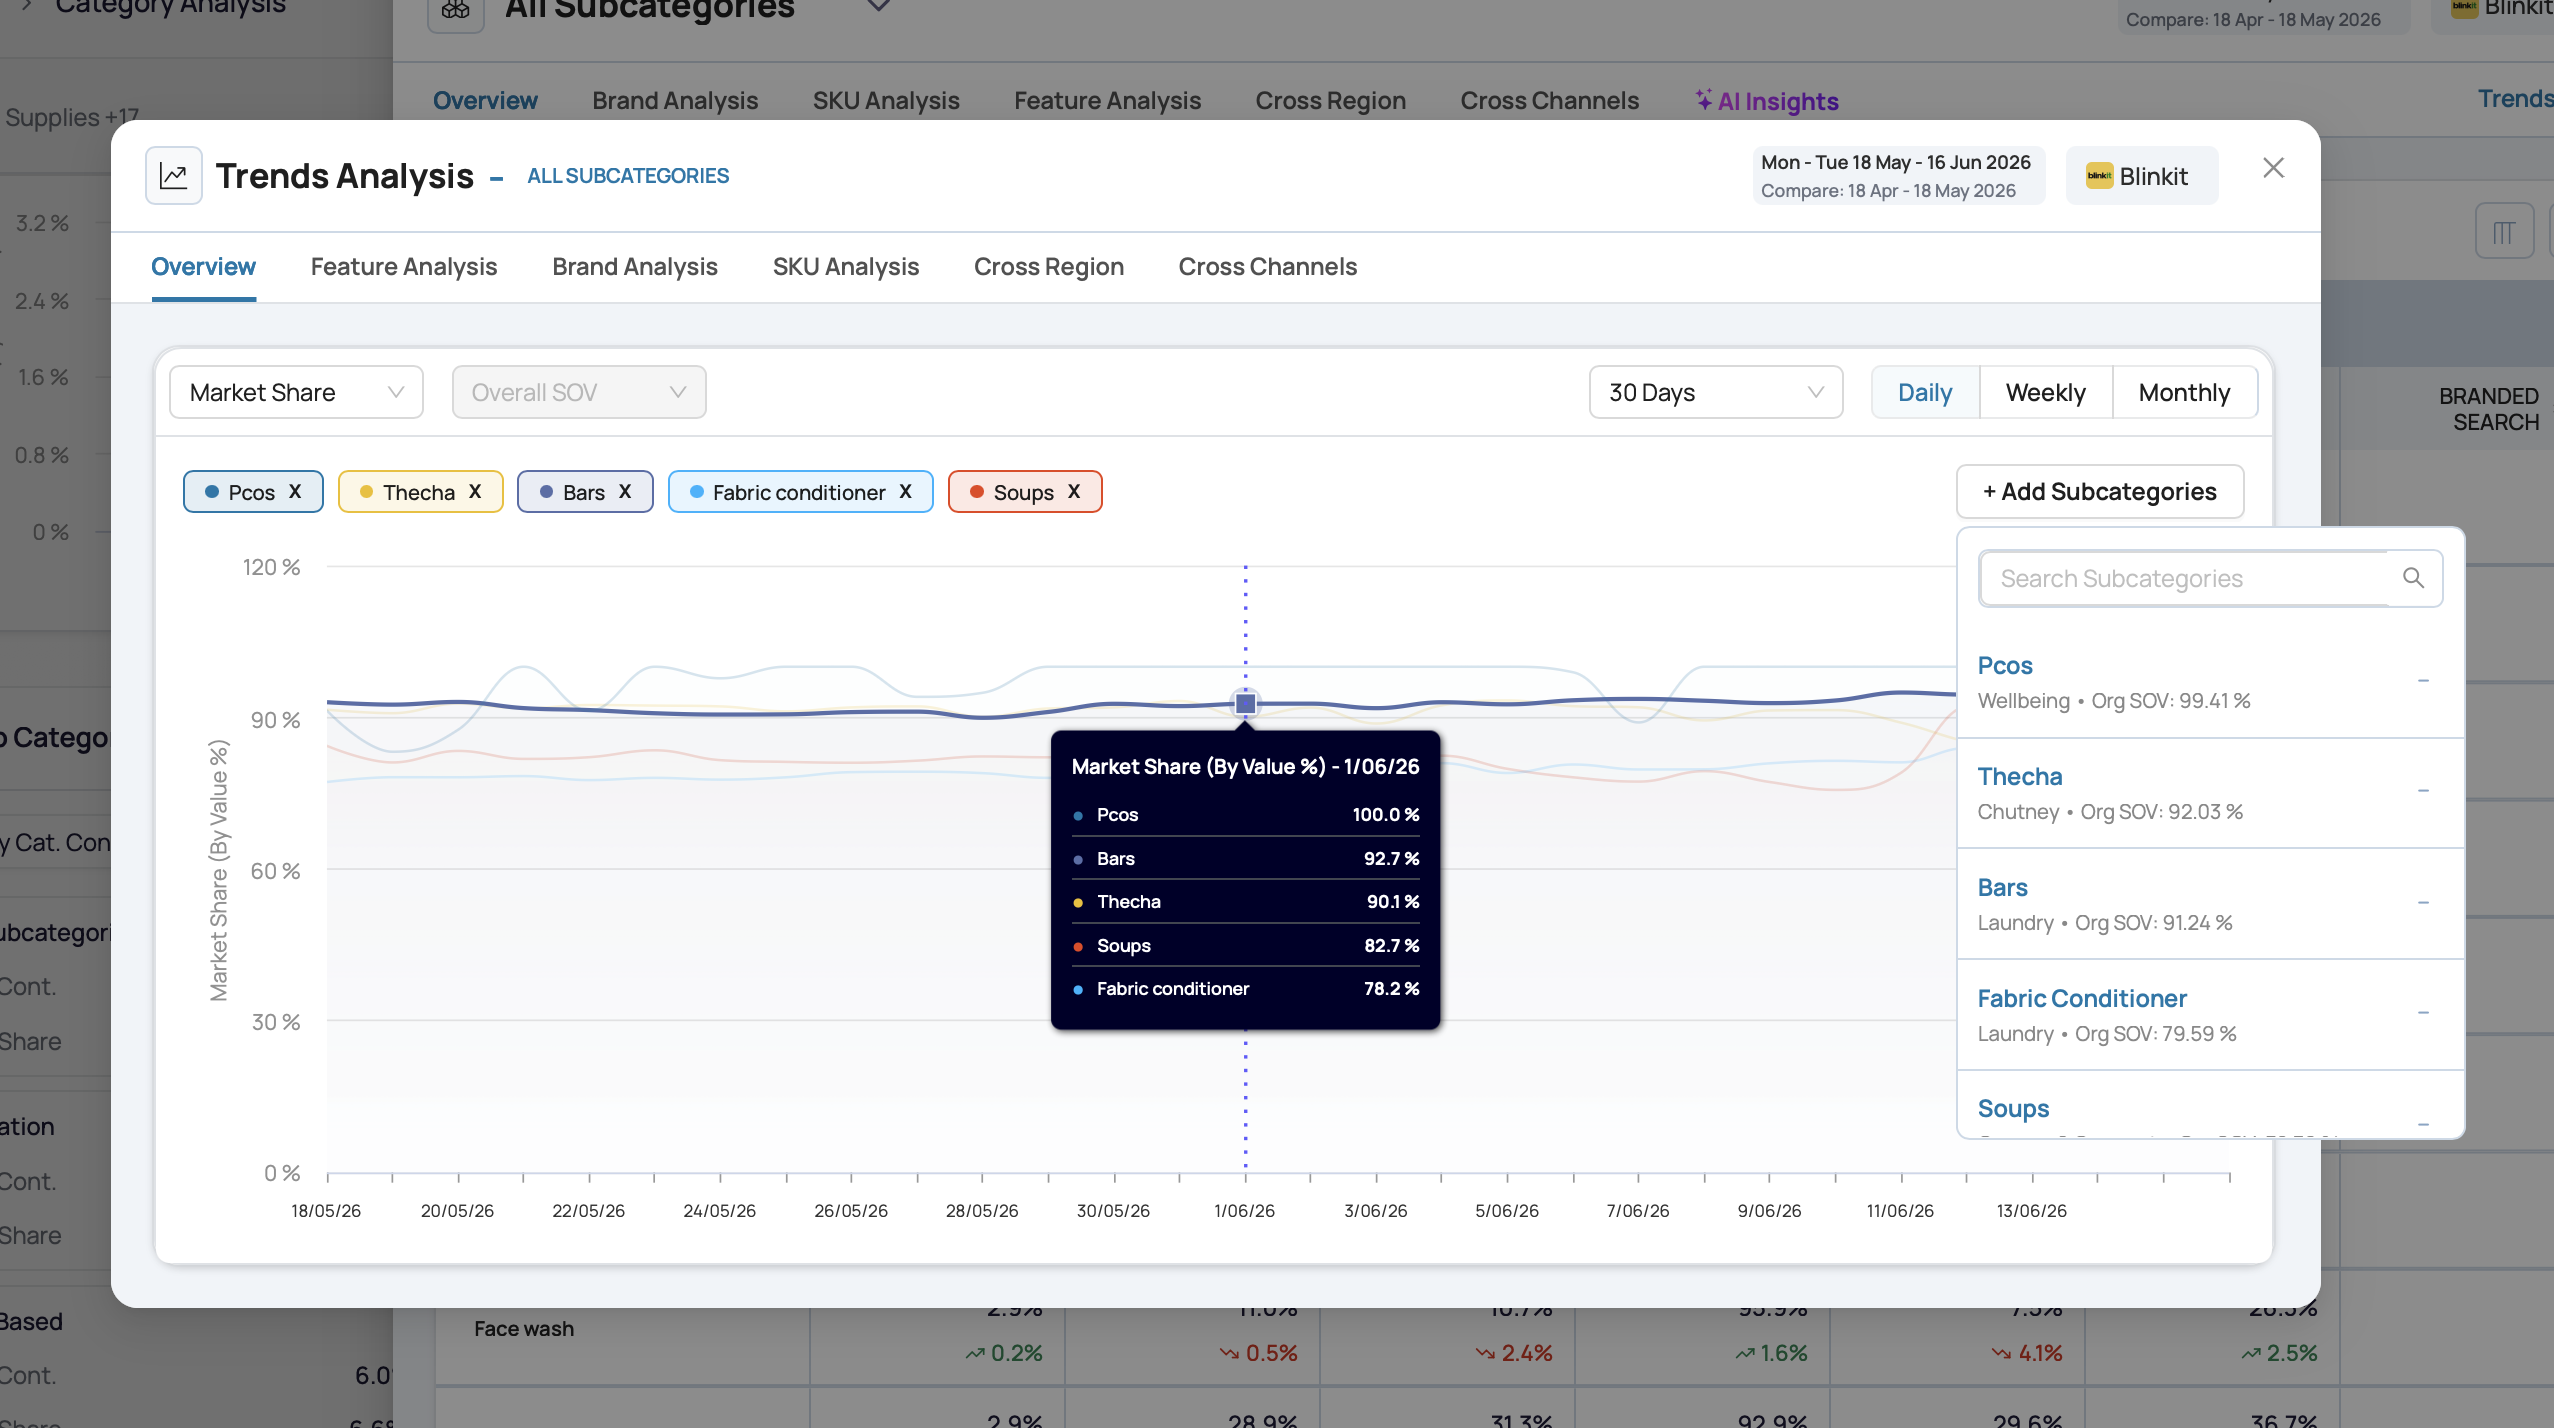
Click Trends View at the top-right of any Drilldown tab to switch to a time-based view of the same data.
- The Trends modal shows one line per row of the tab you came from. So if you opened it from Brand Analysis, you get one line per brand. From SKU Analysis, one line per SKU. From Cross Region, one line per region.
- Use the metric dropdown to change which metric is plotted (default is Market Share).
- Use the second metric overlay to add a second metric on top - for example, overlay SoV on Market Share to spot if they’re moving together.
- Use the Daily / Weekly / Monthly toggle to change the time granularity.
- Use the + Add Subcategories chip selector to bring more subcategories into the chart.
Use Trends View to:
- Tell short-term blips apart from real trends
- Spot seasonal patterns and sudden anomalies
- Check if a competitor’s gain is a real shift or a one-week spike
AI Insights
The AI Insights panel inside the Drilldown gives you the top 5 takeaways for whatever you’ve selected - subcategory, category, SKU, or region.
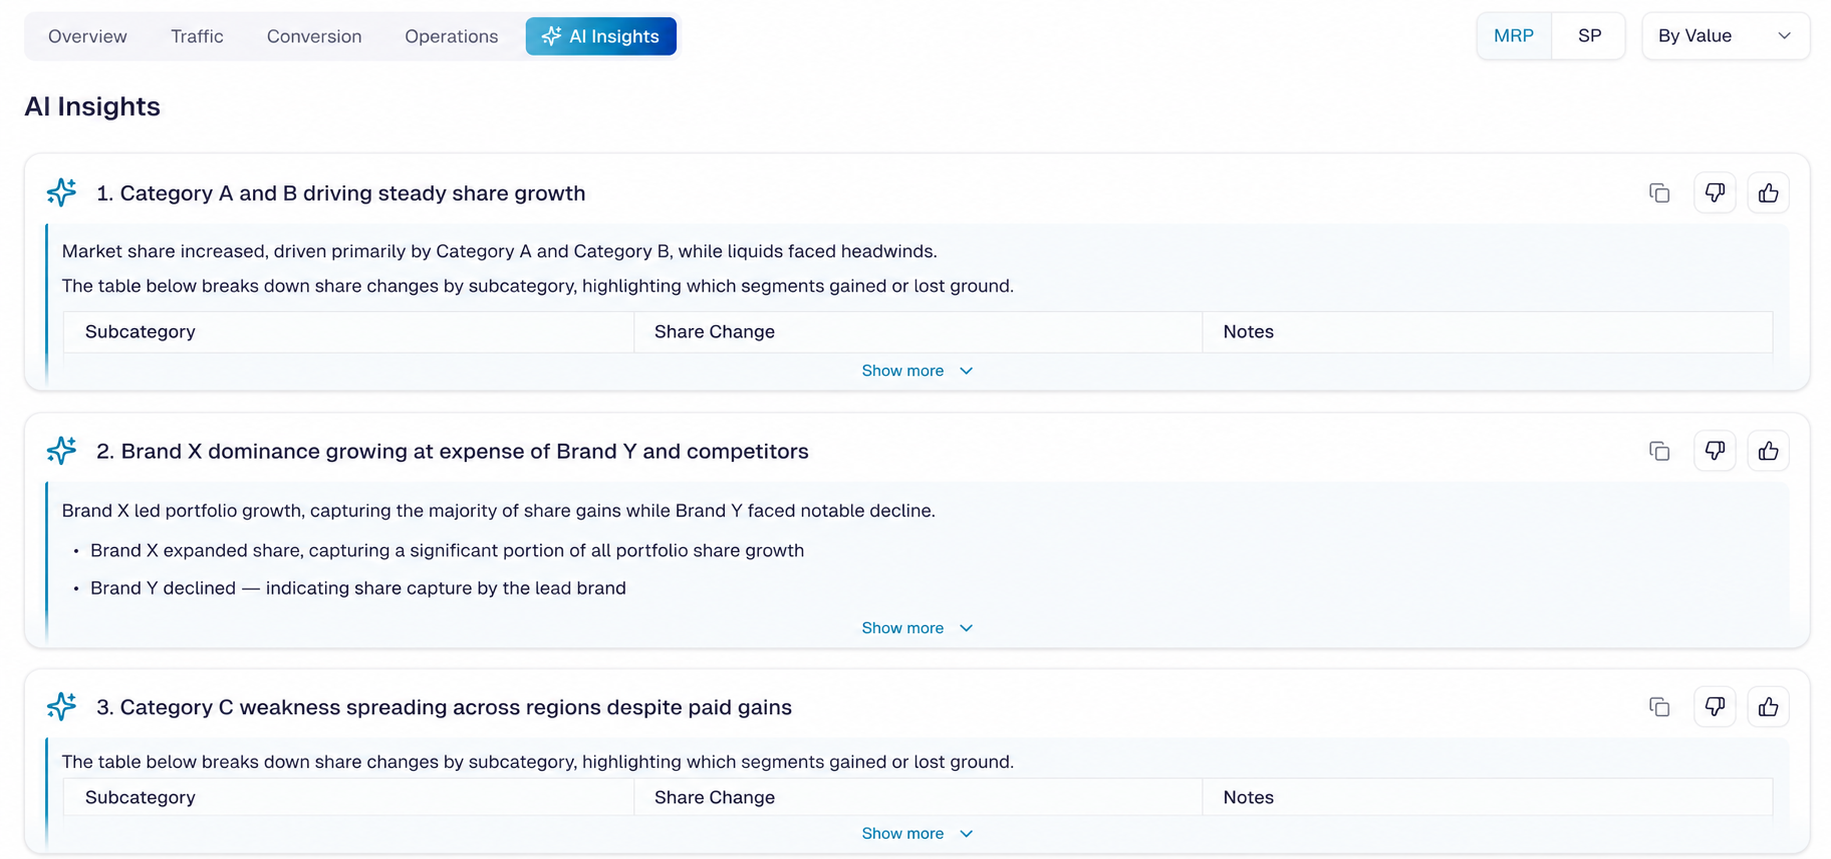
The four areas it covers are the same as the page-level AI Insights tab: what’s working well, where performance is slipping, key anomalies, and opportunities.